One station, 31 days, nothing in the bucket
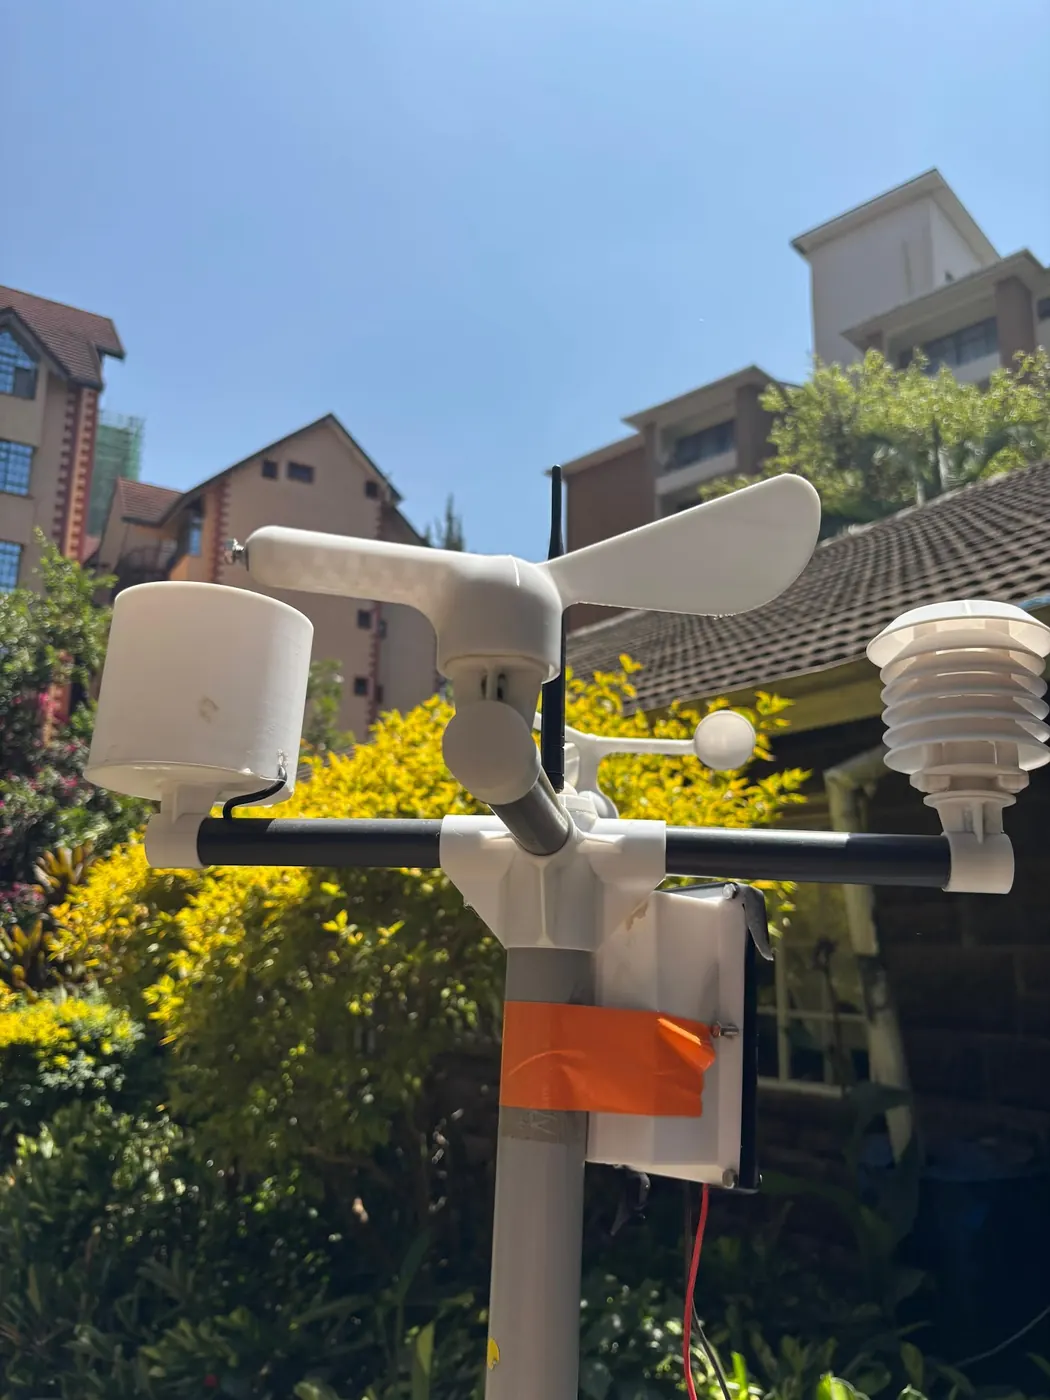
One of the 15 NuaSense stations in Kenya we pull rainfall from logged 0.0 mm between 16 October and 15 November 2026. Not a low total. Nothing at all. Over the same 31 days another station recorded 143.1 mm. Every calendar hanging in an agrovet shop puts that window inside the short rains, and so did the Kenya News Agency's report of the Nyeri outlook, where the KMSA Nyeri director said the first showers were expected towards the end of that week, with much of the rain from the second and third week of October until January. So for one station the short rains had not started by the middle of November. For another they were well under way. Our stations do not sit together and we do not publish where they stand, so this is a spread between places, not a regional figure. The spread is the point, though. A single onset date for the short rains, printed in an outlook and repeated at a cooperative meeting, was wrong by at least a month for somebody.
Rain is rarer than its reputation suggests, too. That window gave us 32,097 ten-minute readings, and 1,083 of them carried any rain at all. That works out at 3.4 percent. The rest, 100 minus 3.4, or 96.6 percent, was dry. Even the station that logged 143.1 mm spent most of the month waiting. From a tipping bucket, that is what an onset looks like: long silence, a burst of tips, silence again. You cannot tell from the burst alone whether it was the onset or a false start. That depends on what the bucket does next, and the rest of this piece is about how to read it.
Forty-three Novembers in one column
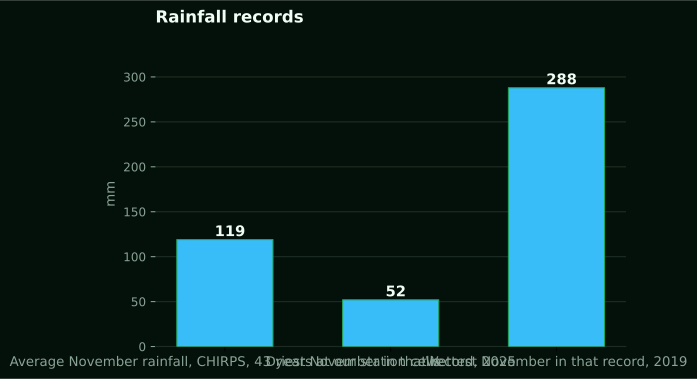
Our stations sit in grid cells that carry a CHIRPS daily rainfall record running from 1983 to 2025, 43 years. Average November rainfall across those cells and you get 119 mm. The driest November in the record was 2025, at 52 mm. The wettest was 2019, at 288 mm. Those three numbers are all the title promises, and the honest thing to add is what they leave out: an onset date. Not one. A monthly total is thirty days added up, and you cannot un-sum it.
The spread still deserves a look. 288 minus 52 leaves 236 mm, the gap between the wettest and driest November across the cells where our stations stand. 52 divided by 119 is 0.44, so the driest November carried less than half the average. 288 divided by 119 is 2.4, so the wettest carried nearly two and a half times it. Plan on an average November and you are planning on a month that, in the extreme years, looked nothing like the average.
CHIRPS needs describing plainly, because it is not a gauge. The Climate Hazards Center's description of CHIRPS says the product covers 50 degrees south to 50 degrees north, runs from 1981 to near-present at 0.05 degree resolution, and is built from the CHPclim climatology, satellite imagery and in-situ station data. Our 43-year series is the slice of that product sitting under our masts. It is a satellite-and-gauge estimate for the cell, not a reading from the mast. The 2025 figure of 52 mm is the estimate for a November our own buckets were counting too. The two will not agree to the millimetre, and the sections that follow say why.
A monthly total hides the day the rain began
Take that 119 mm average. It can arrive in several ways. One storm drops most of it in a single afternoon, then nothing. Or a fortnight of light showers that never wets below the surface. Or a proper onset: a wet spell that holds and keeps the top of the profile from drying back. A monthly column shows the same 119 mm for all three, and a grower would live through them as three different seasons.
Our own record shows how concentrated rain is. Across the 15 stations from 16 October to 15 November 2026, rain showed up in 3.4 percent of ten-minute readings. If that small share holds in other seasons, a November total is carried by a handful of events, and the date of the first one is what the word onset is reaching for. CHIRPS is daily, so in principle a 43-year daily series could be turned into 43 onset dates. We have not done that derivation, and we will not quote a number nobody has derived. This article gives the method; running it on your own daily record is yours to do.
Drying sits on the other side of the balance. Reference evapotranspiration, worked out hourly with FAO-56 from our station readings, averaged 1.4 mm per day across 16 stations in the same window. That is reference ET0, not crop water use, but it matters for onset. A day of rain followed by many dry days is being drawn down at roughly that rate from a reference surface. An onset defined only by rain falling ignores the drying that comes after it, and the drying is what turns a hopeful start into a false one.
Your gauge is a point and the CHIRPS cell is an average
One CHIRPS value covers a 0.05 degree cell. The Climate Hazards Center is blunt about this: estimates from satellites are averages over an area, they carry biases over complex terrain, and they often understate how intense extreme events are. Grids built from station data fare worst in rural areas with few gauges. Most Kenyan farms are in rural areas with few gauges, and many where the short rains matter lie on terrain that is anything but flat.
Put the two side by side. A tipping bucket on a mast catches what falls into its funnel and reports a point measurement, worked out from counted tips at the per-tip volume the gauge is calibrated to. A CHIRPS cell reports what the product estimates fell on average across the whole cell, after blending the satellite signal with whatever gauges fed the station layer. A burst a grower watched from the veranda, the one that filled the drum, can get smeared across the cell and show up as a modest daily figure. Or a storm on the far side of the ridge can lift the cell's value for a farm that stayed dry.
This is the same point the post on why the nearest weather station does not describe your farm makes about gauges next door, and it bites harder with a gridded product. For a long-term average the cell is useful: 119 mm over 43 Novembers smooths out the point-versus-area problem. For an onset date on a specific block in a specific year, the cell is the wrong tool. Our 0.0 mm and 143.1 mm stations may well sit under cells whose estimates were far closer together than that. We have not checked, and the argument does not need it.
Rain moves through Kenya rather than switching on
In the climate profile of Kenya published through the UNCCD, the short rains are the ITCZ carrying rain southwards through the country from October to December. Keep hold of the word southwards. The rain band moves. It does not reach everywhere on the same morning. That is why a national onset date is fiction for any one farm, and why two stations in the same month can read 0.0 mm and 143.1 mm without either one being broken.
That Nyeri outlook made the same point using county names. It described October as the onset of the October to December short rains over much of Kenya, with Meru, Tharaka-Nithi, Murang'a, Embu and Busia getting more than 200 mm, and 18 counties placed on red alert for flooding and mudslides. Those are seasonal totals and warnings issued at the time, reported here as what was said and nothing more. Even inside an outlook, onset is a month and a region, not a day and a farm.
One caution in the outlook bears repeating. Kenya last experienced El Nino in 1997, while the 2015 El Nino had a higher index but led to lower rainfall and less significant effects than had been anticipated. A stronger index did not buy a wetter season. That is a reason to distrust any rule that runs from a global signal straight to a decision in the seed store, and to trust the bucket on the mast, which records what actually fell. A gauge is never wrong about rain that has already fallen. An outlook can be, and 2015 was the year it was.
Three things called onset
Sources use one word for three measurements. First, meteorological onset: a timestamp a forecaster attaches to an event. On the Kenya Meteorological Department's heavy rainfall warning page, a Tana River alert carries an onset of 2026-02-21T15:00:00+03:00 and an expiry of 2026-02-25T18:00:00+03:00. Rain over the Lake Victoria Basin, the Rift Valley and the highlands including Nairobi was expected to pass 20 mm in 24 hours on 21 February, rise past 30 mm in 24 hours on the following three days and spread to the southeastern lowlands and the south coast, then ease on the 25th. That alert concerns February 2026 and has nothing to do with the short rains; it is quoted for the shape of the thing. Onset here is the hour an event is judged to begin, written to the minute and the time zone.
Second, the farmer's onset. In the Bangladesh study discussed below, farmers' perception of when sufficient rains arrived did not necessarily match meteorological definitions. Sufficient is the word that matters. A forecaster asks whether rain has begun. A grower asks whether enough has fallen to stay.
Third comes the advisory. In the Nyeri report, KMSA said it was not giving any advice on what crops to plant. It left that to agricultural extension officers. That division is right, and this site sticks to it. When the short rains are the planting window, crop by crop and region by region, the NuaSense breakdown of planting cycles in Kenya is where that argument lives. This article stops at the gauge. There is a fourth use as well. The NDMA's 2024 short rains assessment was undertaken between 20 January and 18 February 2025 across 23 ASAL counties. That is onset and the whole season judged after it ended. Keep the four apart and most arguments about whether the rains have started dissolve.
Why a false start costs most in the east
In the FAO's Kenya report written after the failure of the 1997 short rains, the short rains crop is only one quarter of annual cereal and pulses production in bimodal rainfall areas. It is the main crop in Eastern and North-Eastern Provinces. That one sentence explains why onset is a regional question. Where the long rains carry the year, a stumbling start to October is an inconvenience. In Machakos, Makueni, Kitui, Mwingi, Mbeere and Tharaka-Nithi, named in the same report as marginal agricultural districts hit by that failure, the short rains are the season.
The report puts the cost in numbers. Aggregate cereal production was revised down to 2.8 million tons, and maize to 2.2 million tons, an 18 percent decline on the previous year. Cereal imports were projected at 1.2 million tons, almost twice the average of the preceding five years. Government declared a national disaster and distributed relief food in 39 districts. A UN mission put 1.4 million people affected. In Wajir, Garissa, Isiolo, Mandera and Marsabit, 500,000 people, some 90 percent of the population, were at risk of food insecurity. Poor pasture and water shortages caused significant livestock losses.
A failed season is not the same as a false onset, and the report does not separate the two. But the mechanism that makes a false onset dangerous is sharpest exactly where the short rains carry the year: a wet spell looks like the start, a decision gets made on it, and then a dry spell follows. Those counties are where a Kenyan onset definition would earn its keep, and where nobody has yet published one.
The Bangladesh method, in plain terms
This is not Kenyan evidence, and it is used here for the method only. A study of agronomic monsoon onset definitions published through PubMed Central analysed historical daily rainfall from four locations across a north-south gradient in Bangladesh. The farmers were Aman rice growers who prepare nurseries around mid to late June and transplant seedlings of roughly 25 to 30 days after the first significant rainfall. A significant delay from late monsoon rains can bring spikelet sterility and yield loss from water stress at panicle emergence and grain filling. None of that transfers to a Kenyan block. Soils, crop, rainfall regime and season are all different. The headline result is a simulated rice result for Bangladesh: a year-to-year varying agronomic onset raised simulated yields by up to 7 to 9 percent and cut the probability of low yields at the two drier locations under rainfed conditions, with no gain at the two wetter ones. It must not be read as a Kenyan field figure.
What does transfer is the structure of the definition. Eleven onset definitions were compared. They showed similar patterns of progression, but some exceptionally early onsets in some cases. Those early calls are the problem. As the study frames it, an agronomic onset threshold uses the initial wet spell in terms of its duration and amount. It also uses a post-onset dry spell in duration and amount, and the local water balance. The aim is to avoid false onsets that can cause early crop failure.
Three parts, then: how much fell, over how many days, to count as a wet spell; how long a dry spell after it would cancel the call; and whether the balance, rain in against evaporation out, stayed positive. Bangladesh chose its numbers for Bangladesh. No Kenyan thresholds for any of the three appear in the sources this article rests on. Inventing them would be worse than leaving them out. What follows is how a farm gets its own.
Write your own onset rule from the gauge
A gauge, a notebook and a fixed reading time are enough. Write the rule before the season, because a rule written during a wet week will be bent to fit it. In order:
- Read the gauge at the same hour every day and write the millimetres down, including the zeros. Zeros are the dry spell, and they matter as much as the rain.
- Keep a running total over a window you choose: short enough that a wet spell stands out, long enough that one afternoon does not fill it on its own.
- Decide, before October, what total over that window you will call a wet spell. Take it from your own past notebooks if you have them, or from the daily CHIRPS series for your cell if you do not, remembering that the cell smooths your bursts.
- Decide how many consecutive dry days after the wet spell would cancel the call. Count zeros from the day the window first crossed the threshold.
- Only when the wet spell has held and the dry-spell check has passed, write the date in the margin as onset. Kept year on year, that date becomes your own onset series.
Try it on the one month we have. A station that read 0.0 mm never crosses a threshold, so no onset fell in that window. The station at 143.1 mm crossed one somewhere, but where the zeros landed decides whether the call survived. A monthly total cannot tell you that. The zeros dominate because of our 3.4 percent figure. On a ten-minute clock, 96.6 percent of that month was silence, so a dry-spell count will almost always be running. Your notebook decides whether it runs past your cancel length.
Now put the long record to proper use. Your cell's daily CHIRPS series gives you 43 Novembers to test a candidate threshold against. That beats reading off an average. Choose a wet-spell total and a cancel length, run them across every year, and count how many years the rule called an onset that the next fortnight of zeros then cancelled. Try a second pair. Count again. Bangladesh found eleven definitions that agreed on the broad pattern and disagreed on the early years. The early years are where money is lost. In 2025 the November total was 52 mm, and a threshold that fires on a single storm is the one most likely to be followed by nothing. In 2019 it was 288 mm, and almost any rule fires and holds. A rule is only interesting in the years between.
The rule is not a forecast. It never says when rain will come. On a given morning it only says whether what has already fallen counts. Keep it that way, and it stays honest in a season like 2015, when the index pointed one way and the buckets another.
CHIRPS v2 ends after December 2026: keep your series on one product
Build an onset series from CHIRPS daily data and a continuity problem waits. Per the Climate Hazards Center, CHIRPS v3 is now available. Production of CHIRPS v2 will end after December 2026, and users are encouraged to move to v3. Our 43-year November series comes from the v2 era. v2 is not discontinued; it keeps producing through December 2026. After that, any series that wants a 2027 November will have to take it from v3.
Both products come from the same group for the same purpose, and nothing in the source says they disagree. But a product with a new climatology, new satellite inputs or a new station layer will not reproduce the old one to the millimetre. An onset series is sensitive to exactly the small daily differences a monthly total hides. A threshold crossed on one date in v2 may be crossed a day or two later in v3. The series would then carry a step that is the product changing, not the climate.
Do the fix once. Download the v3 daily series for your cell over the full overlap. Re-run your onset rule on it and compare the onset dates with the v2 ones before you accept any v3 year. If they agree within a tolerance you set in advance, carry on with v3 alone. If they do not, re-derive the earlier years on v3 so the whole series sits on one product. Never splice. A farm's own record obeys the same rule. A gauge moved to a new mast, a replaced funnel, a change of reading hour: each is a product change inside your series, and the date goes on the page. Our rain gauges page describes the tipping-bucket mechanism. The honest reason to describe it is that a swapped bucket is a swapped instrument.
Gauge, station or nothing: what to change on Monday
For the onset question on its own, a manual gauge is the right purchase. For a farm that already owns one, no purchase is the right call. Everything above needs one reading a day at a fixed hour, and a plastic gauge read by the same person every morning delivers it. Spending KES 30,000 on a weather station to answer a question a jug can answer is the wrong trade. We are the ones selling the station.
A station earns its price when the question changes. It reports roughly every ten minutes, which is how we know rain sat in 3.4 percent of intervals rather than only that a month totalled 143.1 mm. It records the hour of the burst, so the dry-spell count starts from the right day without anyone standing in the rain. And the same mast computes leaf wetness, which ran at 34 percent of station-hours in our window, about 8.2 hours in an average day, and a spray window index on which 57 percent of hours scored below 30 and 22 percent scored 60 or better. Onset is one line of that output; disease hours and spray timing are the lines that justify the mast. Our post on what a farm weather station costs in Kenya lays out the KES 30,000 price excluding taxes, the data fee passed on at cost and the three-month money-back guarantee, and the weather stations page lists what the mast measures.
Monday, then. Fix the time you read the gauge, and tell whoever takes the reading that zeros get written down. Before the next rain, write a wet-spell threshold and a dry-spell cancel into the front of the notebook, dated. Pull the daily CHIRPS series for your cell. Run the rule across the 43 Novembers to see how often it would have called a false start. Stop asking whether the short rains have started in Kenya; ask whether they have started on your block, and let the bucket answer.