Over the four weeks from 31 August to 27 September 2026, four NuaSense weather stations in Kenya recorded rainfall totals of 0.4 mm at one end and 65.7 mm at the other. Nearby weather stations, standing on farms that are not far apart by Kenyan standards, produced numbers that belonged to different seasons. If you had used any one of those four stations to plan a spray or a planting date for a farm near a different one, you would have been working from the wrong month entirely.
That is the fact this whole piece hangs on, and it deserves a moment before you reach for any international study. Temperature is fairly even across a landscape. Rainfall is not. A station a few kilometres from your farm can still be reporting a different season.
Measured by NuaSense weather stations and soil probes on Kenyan farms, over the period stated with each figure. Past readings, not a forecast.
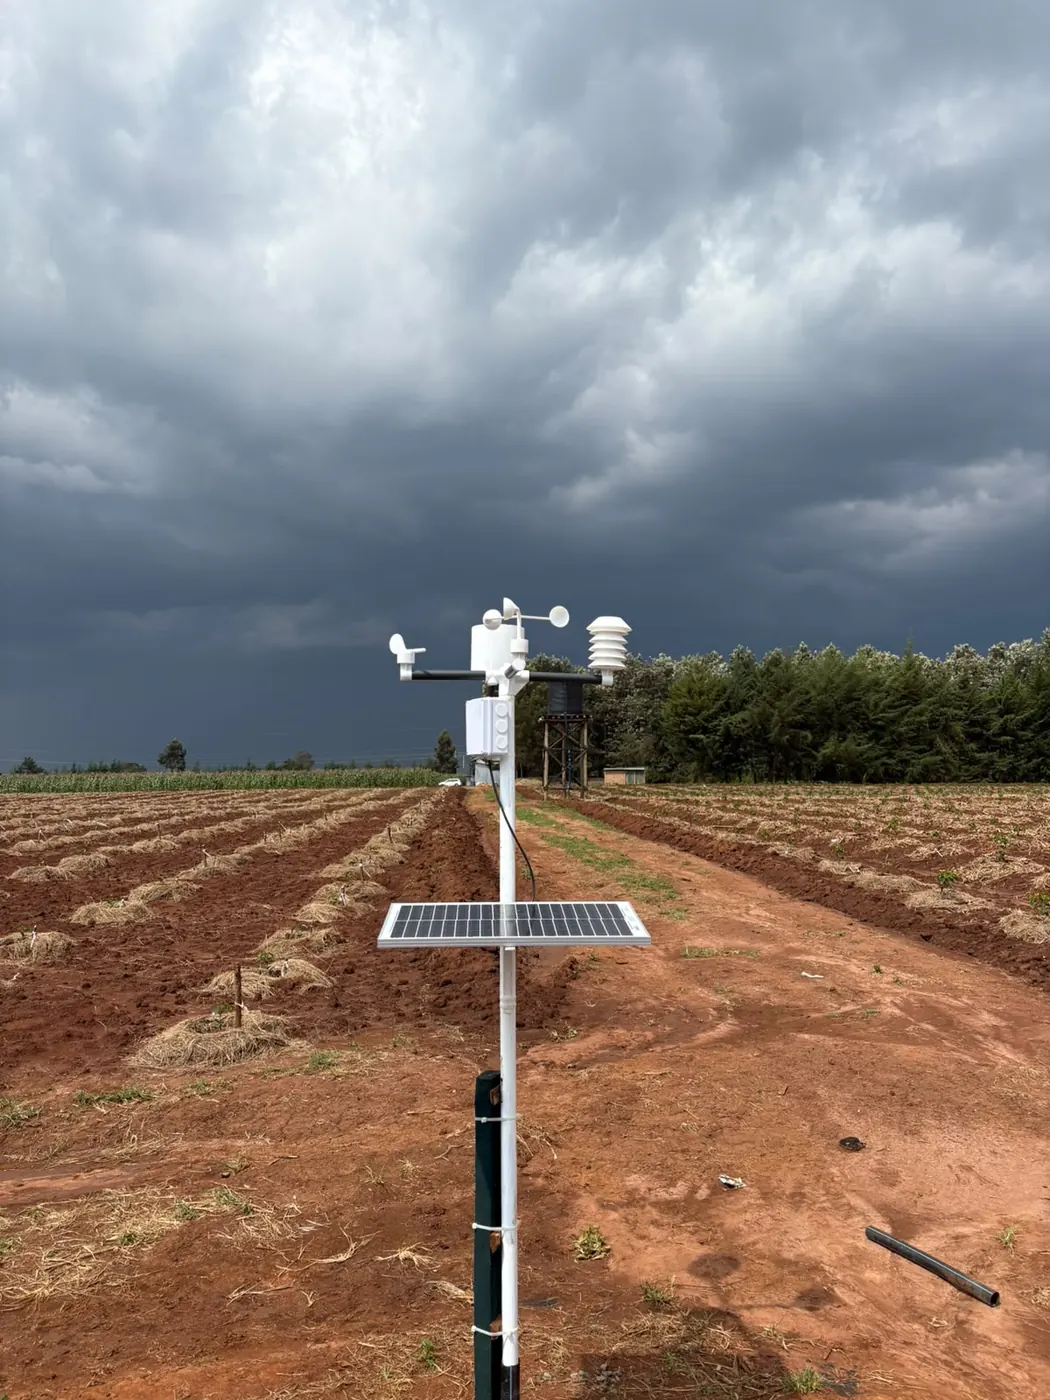
The spread inside our own network
The four stations behind that 0.4 to 65.7 mm range are not co-located. The figure is a measured spread between separate installations, not one region's rainfall total. For the same period, air temperature across the wider seven-station network ran from 3.7 to 36.5 degrees Celsius with a mean of 18.8, and relative humidity averaged 71 percent while ranging from 18 to 100. Between the driest and wettest station, rainfall moved by a factor of over 150. Temperature and humidity swung widely too, but across the whole network rather than between neighbours a few kilometres apart. That is a different kind of variability.
This matches what the World Bank's analysis of satellite and gridded weather products found when it compared nine commonly used earth-observation datasets against household survey locations in Malawi, Ethiopia, Niger, Nigeria and Tanzania. Temperature agreed across datasets far more than rainfall did, which the authors suggest may reflect how much steadier temperature is across the tropics generally. Rainfall, by contrast, was messier: in most cases at least two datasets disagreed on the sign of an estimated effect, and at least one dataset returned a statistically significant result while others returned nothing at all.
Rainfall is the variable that breaks first
The World Bank piece says plainly that ERA5, a reanalysis product, often reports substantially more rainfall than other African data sources, except in Niger, where it reports substantially less than any of them. The disagreement does not point one way. CHIRPS blends satellite imagery with ground station data; ERA5 assimilates multiple sources through a physical model. Different assumptions, different answers. Picking the more famous product does not close the gap.
None of that research happened in Kenya, and none of it is about station siting specifically. It is about which gridded dataset to trust for research. But the mechanism underneath transfers directly: rainfall is spatially patchy in a way temperature is not. Same reason our own four stations produced a 0.4 to 65.7 mm range in one month. A shower that soaks one ridge can miss the next valley completely. When a Kenyan grower reads a neighbour's rain gauge total, they are trusting that the cloud which watered their field watered the neighbour's too. Nothing says it did.
How far is too far depends on what you are reading
An Arizona Cooperative Extension grower's guide on selecting and siting weather stations puts a number on this, citing World Meteorological Organization guidance: weather data counts as reliable within a 60-mile radius for large-scale patterns, but only within 6 miles for local applications such as precision farming. Depending on the decision the reading feeds, the acceptable distance shifts ten-fold.
That same guide ran a direct comparison at a field in Gila Bend, Arizona, over the week of 12 to 19 February 2025. Relative humidity measured right at the field was checked against the nearest AZMet network stations: Paloma (15 miles), Buckeye (27 miles) and Harquahala (41 miles). All three differed meaningfully from the field measurement. The guide notes the gap matters because relative humidity feeds straight into reference evapotranspiration, which drives irrigation scheduling. A wrong humidity reading does not stay abstract. It turns into a wrong irrigation decision.
Six miles, about ten kilometres, is a threshold US precision ag uses. It was measured on flat, irrigated desert with a dense reference network behind it. Kenyan ground seldom stays that even across ten kilometres. A ridge, a valley, a shift in soil or canopy can all sit within that radius. We cannot honestly swap in a Kenyan distance figure, because this evidence does not give one. What carries over is the logic: close enough gets much tighter once you stop describing weather in general and start scheduling an irrigation or spray on one field.
Where the reading was taken changes what it means
Distance only gets you halfway. The University of Florida IFAS guidance on farm weather stations says straight out that airport or city stations are not good references for farm decisions. Rainfall varies too much across space, and built-up areas skew temperature. Its siting rules call for an open, level area at least 10 metres across. The nearest obstruction should be no closer than four times its height. And keep at least 30 metres from any large paved surface.
The NEWA placement guide from Cornell has a rule just for rain gauges. Any wall, tree or fence near the gauge should not be taller than twice its distance from the gauge. The windier the site, the more the gauge under-records. A gauge tucked against a farmhouse wall for convenience, which many people do, will read low. That low reading has nothing to do with how far it is from your field. It has everything to do with what is standing next to it.
That is why nearby alone is the wrong test. A station five kilometres away in an open field, sited correctly, may tell you more about your rainfall than one two kilometres away behind a shed. If the site itself is compromised, being close buys you nothing. A reader who only checks map distance has checked the wrong thing. Our earlier piece on siting problems goes through how to check a site properly.
Related reading on this site: weather stations, What a farm weather station costs in Kenya.
A cheaper station, built for exactly this gap
The evidence gives its clearest answer from Sri Lanka. The CGIAR account of IWMI's mobile weather stations describes the country as one where rainfall often swings hard over short distances. A downpour can be sudden and intense in one spot while a nearby area stays dry. A WMO-certified station costs around USD 10,000. That price blocks the dense network patchy rainfall actually needs. IWMI's mobile stations cost around USD 250 each, and roughly 80 percent of their components can be made locally. The project started, tellingly, when a scientist checked a weather app on a cloudless day and was told it was raining.
That price gap, roughly forty to one, argues for a denser, cheaper network instead of one expensive station. It also argues for our own hardware, and we should be direct about that here. A NuaSense weather station costs KES 30,000 excluding tax. A soil moisture sensor adds KES 7,000 to 10,000 depending on the variant. That is nowhere near the USD 10,000 WMO reference class, and it does not try to be. It is priced so a farm can own its own reading instead of borrowing one from a station that might be sited wrong, or just too far. If a farm only needs a broad seasonal outlook, not a same-day spray or irrigation call, a station like this is more than the question needs. A public rainfall record is the cheaper answer. Our earlier piece on where to find rainfall records for your part of Kenya goes through exactly that.
What the feature phone workaround gets right, and where it stops
Kenya already has a working answer to part of this, at scale. PlantVillage's account of precision agriculture for smallholder farmers on feature phones describes a system that runs on CHIRPS satellite rainfall data at 5 km resolution and sends it by SMS. A feature phone cannot give GPS, so the system asks the farmer for their nearest primary school and ward instead. That gets the forecast to within a 5 to 9 km radius. In the Long Rains of 2022 alone, PlantVillage sent 8.8 million such messages. Sending 350,000 messages a week costs about USD 1,800.
A 2022 survey of 4,272 farmers using the service found 3,577 said it helped them. Of those, about 51 percent said it helped them plant on time. That is a useful system running at national scale on a tiny budget. But a 5 to 9 km radius band is the same order of distance the Arizona guide flags as already too coarse for local, field-level calls like irrigation scheduling. The workaround was built to get around a phone hardware limit, not a farm precision problem. Read it that way: excellent for a planting-window nudge across a ward, but not a substitute for a reading taken on your own soil.
The 2019 case where the gap actually mattered
There's a case in PlantVillage's own records that deserves a careful read, not just a quick moral about caution. When the March 2019 long rains began, maize in Busia County failed to germinate at all, and for some farmers the seed they replanted failed too. PlantVillage puts the reduced rainfall over Kenya and Uganda down to two cyclones, Idai and Kenneth, which hit Mozambique on 14 March and 25 April and are said to have drawn moisture out of the atmosphere further north.
That link is PlantVillage's own reading of what happened, not a mechanism anybody has independently confirmed, and it should be handled that way instead of repeated as settled fact. What it does show clearly, whatever the exact cause, is that a satellite-derived county rainfall map, even one built at 5 km resolution with the Climate Hazards Center and the Kenya Meteorological Service behind it, only describes an average condition. It cannot tell one farmer whether the rain that fell nearby actually reached their particular plot in the amount their germinating seed needed. About the county, the map was probably right. About the field, it could still be wrong.
Maintenance failures look like siting failures from a distance
Not every gap between a station reading and ground truth comes down to geography. IFAS calls a clogged rain gauge funnel the single most common rain gauge problem, with insects, grass clippings or dirt doing the blocking, and it needs checking weekly or more. Arizona's siting guidance separately lists roads and parking lots near a station as a source of dust, heat and vandalism risk. None of that is a distance problem, yet all of it produces a reading that looks wrong for reasons that have nothing to do with kilometres.
For a Kenyan grower working out what to fix first, this matters. If a borrowed neighbour's reading looks implausible for a week, ask whether the gauge itself has been serviced before you blame the distance. IFAS sums up the tradeoff bluntly: the only thing worse than no data is wrong data, and cleaning up after a broken record can cost more than simply keeping the instrument in working order from the start. A station can stand in the right spot and still lie to you if it's full of dead insects. No amount of proximity fixes that.
When a neighbour's reading is genuinely fine to use
This doesn't mean every borrowed reading is worthless. On the evidence from the World Bank's nine-dataset comparison, temperature is far more consistent across space than rainfall is, so a neighbour's temperature and the broad shape of humidity are reasonable enough for questions like whether frost risk exists this week, or whether the general season is running warm. For that class of question, a well-sited station five or even fifteen kilometres away is doing its job.
What a borrowed reading cannot safely carry is anything rainfall-dependent at field scale: whether to irrigate this week, whether leaves have stayed wet long enough to risk disease, whether a spray window is actually open. Our own network's spray window index, computed hourly from station readings across the FAO-56 evapotranspiration method, scored 60 or better in only 17 percent of station-hours over the same four-week period, and below 30 in 55 percent. That spread is wide enough that a decision timed off the wrong station could easily land in the worst third of hours rather than the best. Leaf wetness averaged 27 percent of hours, about 6.4 hours a day, another network average masking real station-to-station spread. These are exactly the readings the Arizona guide's 6-mile precision threshold was written for, and the readings where borrowing a distant number costs the most.
Where a reading you own actually starts to pay off
The practical answer isn't that every farm needs its own station, and it's worth saying who should not buy one. A farm making broad seasonal decisions, when the rains are likely to start in general, whether a variety suits the area, is well served by the free county-level and satellite records covered in our earlier piece on where to find rainfall records for your part of Kenya. It does not need to spend anything.
A farm timing sprays, scheduling drip irrigation, or trying to catch a real spray window against disease pressure is making decisions at the scale the Arizona 6-mile threshold describes, and that is where owning the reading starts to earn its keep. A NuaSense station at KES 30,000, reporting air temperature, humidity, rainfall, wind and the derived spray window and evapotranspiration figures roughly every 10 minutes, plus a soil probe at KES 7,000 to 10,000 reporting moisture and temperature at two depths, is priced for exactly that decision, not for replacing the free county forecast. The products page covering the full sensor system sets out what each layer actually reports. Whether that spend is worth it comes down to the same question raised throughout this piece: is the decision rainfall-sensitive and field-scale, or is it a broad seasonal call that a neighbour's station, or none at all, already answers well enough.
Also drawn on for this piece: Evaluating meteorological data from weather stations.