The coldest reading was not very cold
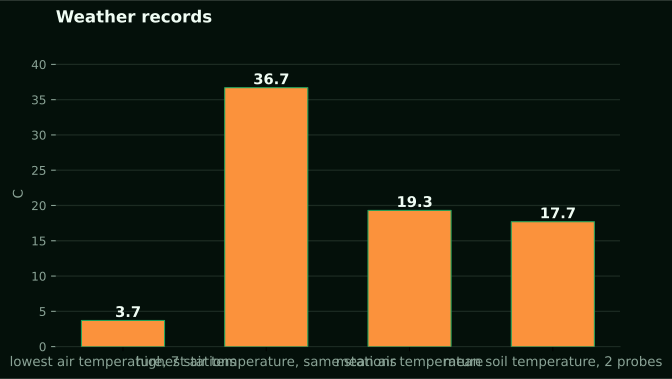
Among 7 NuaSense weather stations in Kenya, from 04 September 2026 to 04 October 2026, the coldest air temperature logged was 3.7 °C. The warmest was 36.7 °C, and the mean was 19.3 °C. If you farm in the highlands, you likely expected a colder night than that. Your first instinct is to distrust the sensor. But that figure says more about how a network is built than about how a cold night behaves.
The spread works out as 36.7 minus 3.7, or 33.0 degrees between the coldest and hottest ten-minute reading in a month. That range comes from pooling stations that do not sit at the same altitude or in the same landscape. Our stations are on private farms, and we do not name their locations, so you cannot tie the pooled figure to one hillside. It shows the floor for the whole group over that month. Nothing more.
One month is also just one slice of one season. The question behind a night-temperature search, how cold does it get where I farm, needs a longer record and a station on your own block. This article starts with the one measurement we have and marks where the evidence ends. When the published East African record disagrees with itself, that disagreement is the most useful thing to learn before you trust any single number, including ours.
What a pooled minimum is, and what it is not
The 3.7 °C figure is the lowest single reading from any of the seven stations in that window. It is not an average overnight minimum. It is not a per-station minimum either. If you want the typical coldest point of a night, you need the daily minimum for each night at one station, then the spread of those minimums. We have not published that cut, and we will not pretend we have.
The network is not a highland sample either. A pooled low of 3.7 °C could come from a high farm on a clear night. It could also come from a modest altitude on an unusually cold one. The data cannot tell those apart. Treat it as a floor for the group.
The mean of 19.3 °C is a blend too. It rolls warm afternoons and cool nights into one value, so it hides what you care about. Humidity gives a clue why. Readings ran from 18 to 100 percent. A reading of 100 percent means saturated air, the kind you get on a cool night near its lowest point. Eighteen percent is a dry afternoon.
Put three questions to any record. Is it a minimum series or a mean series? How many stations stand behind it? Has the station moved? The Kenyan literature fails each one at least once.
Why the lowest reading comes just before dawn
The coldest hour usually comes near sunrise, and the reason is physics, not place. After sunset, the ground and canopy lose heat to the sky. Nothing replaces it. The loss goes on while the sky stays clear and the air stays still. So the temperature keeps falling and bottoms out when the sun starts adding heat back. The curve does not flatten at midnight.
Cloud cover bounces some heat back down, and water vapour slows the loss. A humid night tends to stay milder than a dry one. Our sources do not say how many degrees the difference makes, so we give no figure. The direction is dependable; the size is local.
Wind works the other way. Moving air mixes the cold surface layer with warmer air above it. So a breezy night is less likely to bring a sharp low at crop height. A gust figure from our stations is the peak within the reporting interval, not an instantaneous reading. When you look back over a cold night, check the wind column first.
A daily minimum is therefore a pre-dawn number. A reading at ten in the evening tells you almost nothing about it.
The Kericho record is a mean series from a tea estate
The study you will keep running into for Kenyan highland temperature is Temperature and Malaria Trends in Highland East Africa in PLoS ONE. It uses a quality-controlled series for the Kericho meteorological station, prepared by Omumbo and colleagues with the Kenyan meteorological service. From 1979 to 2009, mean temperature at Kericho rose by 0.21 K per decade, which the authors report as significant at the 1 percent level.
Read that with a night question in mind. It is a mean. It says nothing about the overnight minimum, and a rising mean can come from warmer days, warmer nights or both. The study asks whether highland warming explains malaria, not how cold a tea estate gets at 4 a.m. Using it as a night record asks a question it did not ask.
That gap is where this topic is most honest. Only one Kenyan temperature number behind this article is tied to a place, and it describes the average of the day. Not one source here gives a minimum temperature for any Kenyan highland station. If a brochure hands you a confident figure for a Kenyan highland night, ask where the minimum series is.
The authors also point out that cases at the Kericho tea estate hospital climbed during the 1994 to 2002 epidemics. They have since come back down to a low level, even while the temperature record for that same station warms. Temperature by itself seldom explains what happens on the ground.
The same region gives two answers, and the data is why
What is most useful in the Kericho paper is the argument it lays out. The Omumbo series shows no significant trend for 1979 to 1995, but a highly significant trend across the full 1979 to 2009 sample. Hay and colleagues found no evidence of a significant temperature increase at any East African location they tested. Chaves and Koenraadt used three time-series methods on CRU data interpolated for Kericho and found increases for 1966 to 1996.
You might think the argument is about statistics. The paper says the disagreement comes from differences in data, not methods. Newer editions of the University of East Anglia CRU TS database show significant trends that the older version does not for periods ending in 1996. Once post-1996 data are added, those trends strengthen. Same place, same question, different input, different answer.
Anyone trying to read overnight cold from a short record runs into the same trap. Whether you see a trend or a floor depends on which data version you hold and what period it covers. A single month cannot settle direction. Ours included. It only tells you what happened over those weeks.
Researchers can disagree about whether a station is warming. So a rule of thumb like 'frost comes in July' should be treated with suspicion until you have your own record. That is the best reason to keep a station running through an ordinary year.
A station that moved, and a database that lost its stations
Two details from the same study show why a few years of records can mislead, not just be short. The Kericho weather station moved in 1986, and the Omumbo series was built to account for that move. Moving a station can change readings even when the weather has not changed. For example, the sensor may go from open ground to shelter, or downhill to a spot where cold air collects. You will not see that in a chart unless someone wrote it down.
Second, the number of stations behind the CRU temperature database in the Kericho region has dropped very sharply since the mid-1990s. Omumbo and colleagues point to that drop when they question the database for recent years. When stations thin out, the grid cell gives a smoothed estimate, not a measurement.
This matters a lot for night temperature. Cold air drains into hollows and pools there, so two sites a short walk apart can differ at dawn. A sparse network cannot capture that, and a grid cell surely cannot. Our piece on siting explains how much clear ground each sensor needs. The same logic applies to temperature: where the sensor stands decides what the number means.
When you pull a minimum for your farm from a public product, ask whether a real thermometer stands near you and whether it has moved. If the answer is no, the figure is a modelled guess, not a record of your night.
Altitude inside one region: Bale against Arsi
We have no Kenyan altitude comparison for overnight cold. The closest honest proxy is Ethiopia, and we label it that way. A study of extreme rainfall and temperature in southeastern Oromia gives zone figures. Arsi zone runs from 600 to 4100 m above sea level; there the average minimum and maximum are 12 °C and 20 °C. Bale zone runs from 880 to 3554 m; its mean minimum is 6 °C and mean maximum 21 °C. That is the lowest mean minimum for any zone in the study.
Look at what changes. The maximums are 20 and 21, almost the same. The minimums are 12 and 6, six degrees apart. Afternoons match; nights do not. If that held true in Kenya, daytime temperature would be a poor guide to how cold a highland farm gets. That is a question, not a finding. Nothing in the Kenyan material tests it.
These figures are zone averages, taken across huge altitude ranges. A mean minimum of 6 °C over 880 to 3554 m says something about the zone. It does not tell you about one farm at one height.
What moves to Kenya is the method, not a number. Across altitude, expect minimums to vary more than maximums. Check that with a thermometer at your own crop, instead of borrowing 6 °C.
Cold indices are falling, which means nights are warming
That same Ethiopian study also uses standard indices. TNn is the coldest night of the period. TXn is the coldest day maximum. TN10p and TX10p count cool nights and cool days. In southeastern Oromia, cold indices went down while hot indices went up. The authors call this warming asymmetry. TN90p, warm nights, rose by 0.20 to 0.60 days per year.
That is more precise than saying 'nights are getting warmer'. The cold tail is shrinking. The coldest nights are becoming less cold, and warm nights are more frequent. The record covers nine meteorological stations from 1994 to 2023. At all stations studied, TNx rose by 0.05 to 0.12 degrees C per year.
Now for the limits. This is southeastern Oromia, not Kenya. Our sources do not support any claim that Kenyan highland nights are getting colder. Every trend in them, Kericho included, points toward warming. The study reports that leeward slopes show more hot days while windward slopes stay cooler. It attributes that to topography and rain shadow effects.
A windward farm and a rain-shadow farm in the same county may have different night histories. Do not borrow a regional trend for your block. TNn varied with a coefficient of variation above 30 percent. So the coldest night in any one year is a noisy number.
Frost loss in Ecuador, and why a summit record is hard to keep
In Tungurahua, Ecuador, a study of traditional Andean farming under climate change reports that higher temperatures have reduced frost occurrence. It also says no substantial rise in extreme rainfall or drought has been observed yet. We will not move that finding to Kenya. Our Kenyan material says nothing about frost frequency. Ecuador is a contrast case.
The second case is a mountain. The Ben Nevis hourly observations came from a summit 1345 m above sea level, between December 1883 and September 1904. Matching readings were taken near sea level at Fort William. More than 3500 volunteers recovered over 1.5 million observations in under three months. The observatory closed in October 1904 because its running cost far exceeded its income.
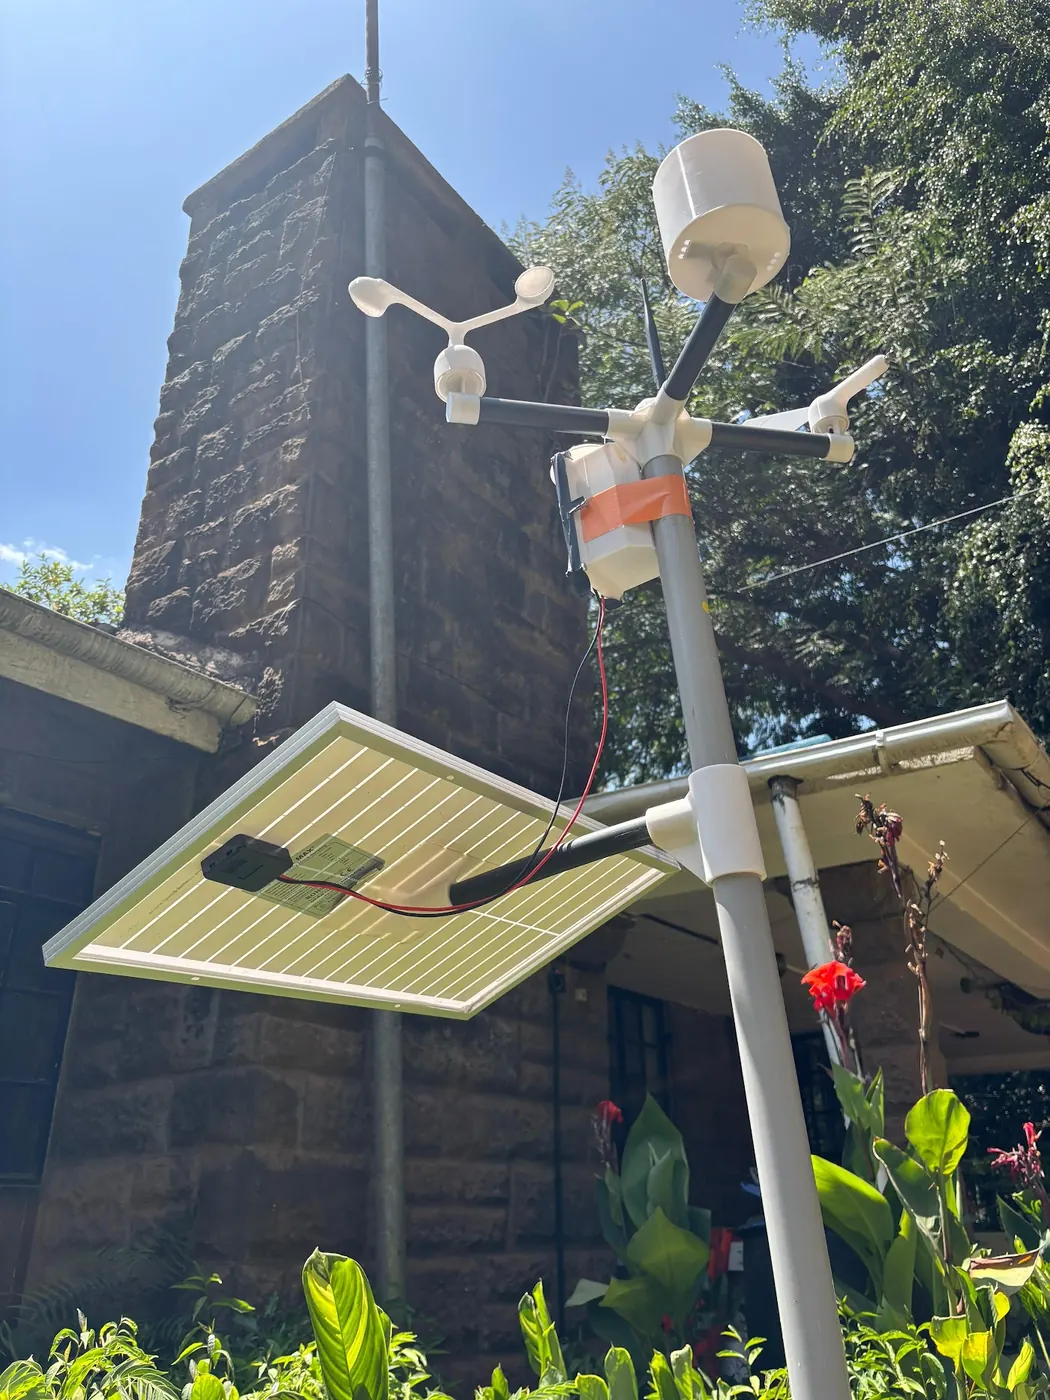
At that site, winter conditions could be so severe that getting up to the observatory was impossible, and supplies came up by pony only between June and November. High, cold sites are expensive to run and hard to staff, which is why records for the places where cold matters most go missing. Scotland is not Kenya, and we apply none of its numbers to a Kenyan hill. The point is institutional: a solar station that reports over the mobile network removes the climb.
What a cold night does to a crop
Our sources give no crop damage threshold, so we give none. Thresholds vary by crop and growth stage and belong to the agronomy for your crop. A station tells you what the air did. The air is only part of the story.
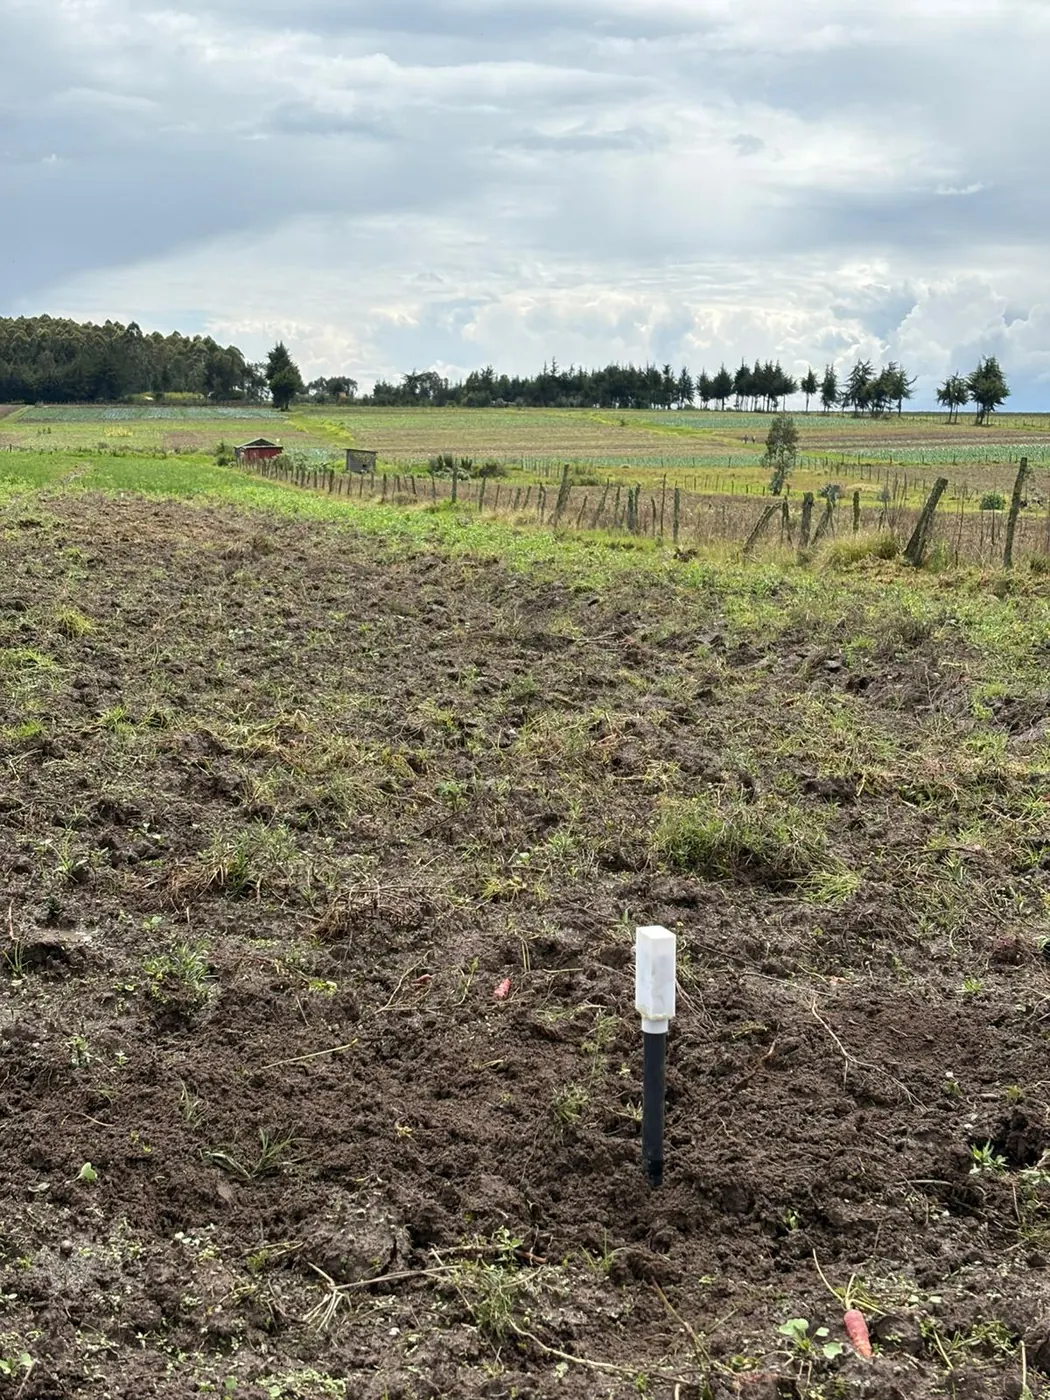
Now the soil. Over the same month, soil temperature across 2 NuaSense soil probes averaged 17.7 °C. Each probe reads at two depths, and those depths behaved differently: the steadier depth moved through 1.4 °C, while the more variable one moved through 2.4 °C. That is a factor of 1.7 if the steadier span is taken as one. We publish no centimetre figure for either, since burial depth is chosen per installation. The root zone is buffered against the air, so 3.7 °C in the air does not mean 3.7 °C at the roots.
Leaves tell the other half. Across the month, 25 percent of station-hours were leaf-wet, which works out to about 6.0 hours on an average day. That figure is network-wide, not night-specific. Still, cold nights bring dew, and wet foliage is where disease risk begins.
The canopy can be colder than air at a mast, so the reading guides your canopy rather than measuring it.
Farmers notice, and the national report is silent on minimums
Ombogoh's 2016 study, on adapting to climate variability in the East African region, reports that most smallholder farmers in Embu and Kapchorwa have experienced the effects of rainfall and temperature variations. That is experience, not an overnight cold measurement.
The national picture does not settle this question. The Kenya Meteorological Department's State of the Climate report for 2025 analyses monthly station data. It says March and April recorded the highest values in space and time, while much of the country was near to below average. The excerpt does not name a variable, station or value, so we will not say it describes minimum temperature.
If the national record gives no minimum for your valley, your own instrument is the route left. That is where the sources leave a manager: stations spread wide apart, a trend that is contested, a public database that is shrinking and a night coldest just before dawn.
What to change on Monday
Find out whether a thermometer stands within reach of your block. Do not just trust an app or grid. Our piece on weather station siting problems says these problems are usually an afternoon's work to fix, and the same fixes apply to a temperature sensor. Write down any move you make. Relocation changes a series, as Kericho's did in 1986.
Change what you read, then. Quit watching the daily mean and the afternoon high. Take the lowest reading from each night and write wind, humidity and leaf wetness next to it. A station that reports roughly every 10 minutes shows you the shape of the fall. Look at how weather data from our stations is arranged.
Build a longer record first, before you decide on planting or protection. The NuaSense guide to when to plant in Kenya sets out planting cycles by season and region. A season of your own minimums shows where your block sits within that advice.
Don't borrow a number. That 3.7 °C floor, Bale's 6 °C and Arsi's 12 °C belong to someone else. A weather station goes for KES 30,000 excluding taxes, and a soil sensor for KES 7,000.