Weather station siting is not a checklist item you tick off once the mast is standing. It is a set of trade-offs that decide, before a single reading is logged, how much of what the station reports you can actually trust. Height, exposure and distance from obstacles each pull the numbers in a direction, and on most Kenyan farms at least one of the three is compromised by the field itself: a fence line, a windbreak, a shed roof that was there before anyone thought about a weather station.
Measured by NuaSense weather stations and soil probes on Kenyan farms, over the period stated with each figure. Past readings, not a forecast.
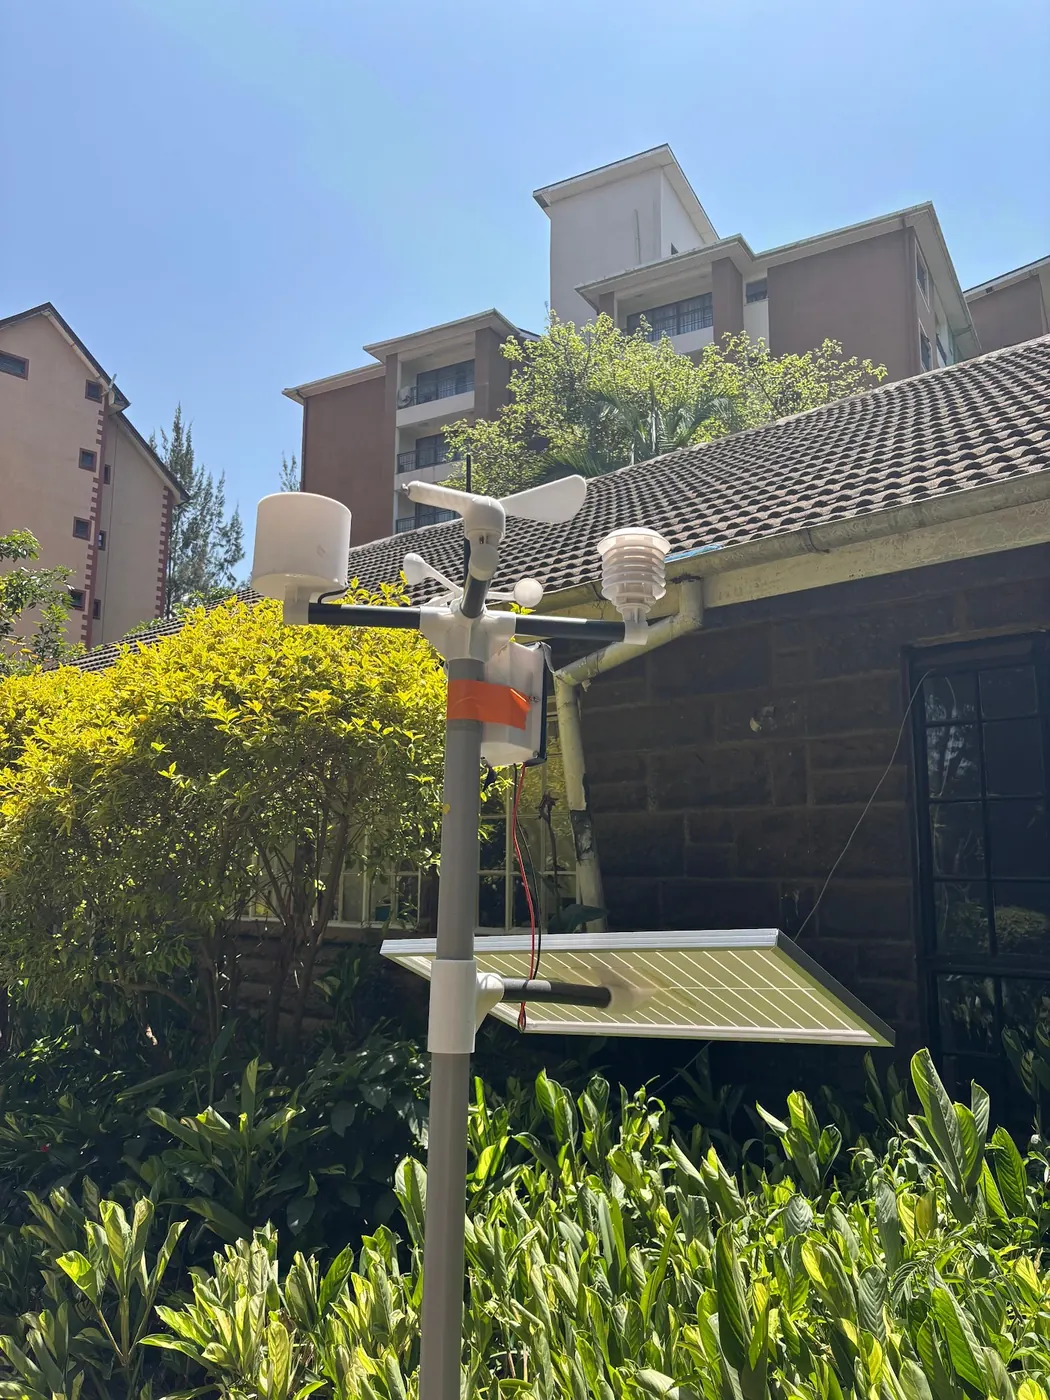
The three numbers that get argued about
Height is the first fight. Agricultural weather stations typically put the temperature sensor at 1.5 to 2.0 metres, while national meteorological services standardise around 10 metres, according to the Springer Nature chapter on weather station siting. Those are two different instruments answering two different questions. A national network wants a height that is comparable across a whole country's synoptic stations. A farm wants the air the crop canopy is actually sitting in. Cornell's NEWA placement guide is specific about this for agriculture: temperature sensors belong 4 to 6 feet up, preferably 5 feet. That is close enough to the 1.5 to 2.0 metre agricultural convention that the two sources agree on the point, even though they were written for different countries.
Exposure is the second argument. It is less about a number than about surface. The same Springer chapter notes that temperature sensors need double shielding from short-wave radiation. Otherwise the sensor itself warms in direct sun and reports air that is hotter than the air actually is. The National Weather Service's CWOP siting standard adds a second failure mode from the ground up. Dark, slow-cooling surfaces like concrete or bare rock bias the reading warm long after the sun has moved. The surface itself is still radiating heat into the sensor's footprint.
Distance from obstacles is the third. It is the one growers most often get wrong, because it looks like common sense until you do the arithmetic on your own field.
Ten times the height, and what that means on an actual plot
The general rule comes from the Arizona growers' guide on weather station selection and use. Site the station about ten times the height of the nearest obstacle away from it. A three-metre windbreak, then, needs thirty metres of clear ground before the wind sensor sees undisturbed air. Most smallholder and even mid-sized commercial plots in Kenya do not have thirty clear metres in every direction. Not from a fence line, a mango tree or a store shed.
Ask IFAS's guidelines for farm weather stations split the rule by sensor rather than treating it as one blanket figure. Wind sensors need ten times the obstruction height. Temperature and humidity sensors need four times the height or 30 metres from any paved surface; rain gauges need four times the height. That difference matters practically, because it means a station squeezed against a boundary can sometimes still get useful temperature and rainfall data even where the wind reading is compromised by a nearby tree line. Wind is the sensor that suffers first and worst from a tight site; temperature and rain have more slack.
Cornell's NEWA guide gives a similar structure for the shield specifically. It is no closer than four times the obstruction height, and at least 100 feet, about 30 metres, from any paved or concrete surface. Where these figures were measured in temperate research stations in the United States, the mechanism, not the exact number, is what transfers to a Kenyan block. A fence, a wall or a parked vehicle disturbs airflow and radiates heat for a distance proportional to its own height, wherever it stands.
What the WMO classification actually buys a Kenyan farm
Siting quality is not binary. The WMO Siting Classification exists precisely because of that. It scores how well an installation meets the WMO's own recommendations. The WMO itself is explicit that the classification is not a ranking. A station that scores poorly for wind exposure can still be a valuable temperature or rainfall record for its purpose. Very few sites anywhere achieve class 1 for wind, because that requires a clear 300-metre radius, a standard almost no farm, anywhere, can meet.
The classification also names something growers rarely think about: wind and calm interact with siting error in opposite directions. Moderate or high wind actually reduces temperature error. It keeps air moving past the sensor instead of letting a pocket of warmed or cooled air sit there. Zero or low wind, by contrast, reduces precipitation error. Gusts are what blow rain sideways past a gauge's mouth. A single site cannot be optimised for both conditions at once. That is one reason a perfect siting score does not exist outside a laboratory.
Classifying a station properly, at the standard the WMO documents through Météo-France's own practice, takes about two hours per site. Most Kenyan farms will not spend that. They do not need to. The value of knowing the classification exists is knowing what it is measuring. When a reading looks wrong, the first question is where the mast stands, not whether the sensor has failed.
Shade and dark ground do the same damage from two directions
Two separate siting errors compound each other and both are common on working farms. The NWS CWOP standard flags dark, slow-cooling surfaces underneath a station, concrete pads, gravel, bare compacted ground, as a source of persistent warm bias. The surface keeps radiating stored heat back up into the sensor's footprint well after the sun has set. Cornell's NEWA guide adds the opposite problem from above: a station should not be shaded at any point in the day. Shading understates solar radiation and, by extension, every derived figure that depends on it.
For a farm running an ET0 calculation off its own station, this pairing matters more than a single degree of temperature error would suggest. Both dew point and vapour pressure deficit are derived from the same temperature and humidity readings. A shaded, concrete-backed site would distort those readings. The Arizona best-practices note on siting weather equipment makes the related point about proximity to roads and parking areas. Dust, reflected heat and vandalism risk all come bundled with the convenient site next to the farm track. That is exactly where a station tends to get put, because it is easy to reach.
None of this argues for putting a station somewhere inconvenient for its own sake. It argues for checking, once, whether the ground underneath and the sky above the mast match what the sensor is meant to be reading. Do that before trusting a season of derived numbers built on top of it.
Rain gauges and wind sensors do not want the same site
A single mast carries several instruments and each one has a different relationship with the wind. Cornell's NEWA guide states the rain gauge rule plainly. The best site sits in an opening within a grove of trees, where the protecting height does not exceed twice the gauge's distance from it. As a general principle, the windier the site, the larger the precipitation error. Wind carries raindrops sideways past the gauge's mouth before they fall in. That is the opposite instinct from the wind sensor. It wants the most open, least sheltered spot available, precisely so nothing disturbs the air passing through it.
This is one reason a single-mast station is always a compromise. The Springer Nature siting chapter frames the underlying issue as a site-representativeness problem rather than an instrument problem. Strong temperature and moisture gradients near large water bodies or in hilly terrain need more than one station to capture what is actually happening on the ground. A single point cannot represent a landscape that variable. On the tipping-bucket mechanism itself, which counts tips and converts them to millimetres, siting error stacks on top of the gauge's own catch efficiency in wind. That point is covered in more depth in our earlier piece on where a rain gauge breaks.
Solar radiation sensors add a third, unrelated constraint. Ask IFAS's guidance recommends mounting them on the southernmost side of the mast in the Northern Hemisphere, so the mast itself never shadows the sensor. Kenya straddles the equator. The practical lesson transfers with a caveat rather than a fixed compass bearing. Check where the mast's own shadow falls across the year at your latitude. Do not assume a Northern Hemisphere convention applies without checking it locally.
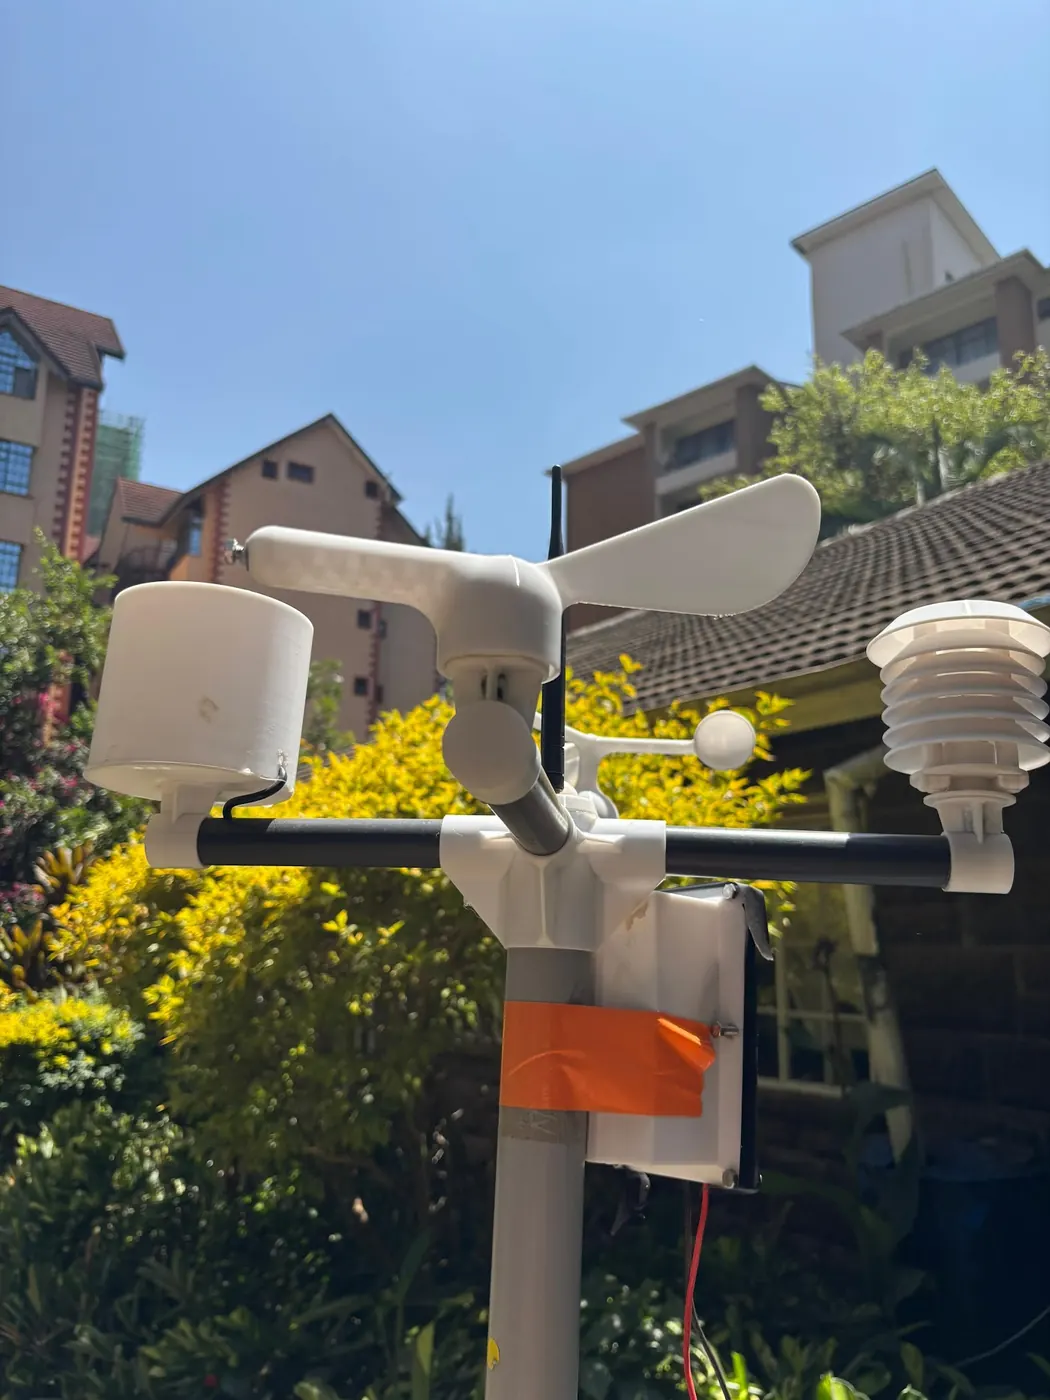
Africa's station network is thin, which raises the stakes on your own site
The siting rules above matter more in Africa than in the countries where most of them were written. There is far less backup data to fall back on when one station is badly placed. AICCRA's documentation of its automatic weather station data tool notes that African weather stations are sparse and their numbers have been declining over the last half-century, and that most existing stations sit in towns and along main roads, leaving rural farmland underrepresented. AICCRA's tool is deployed in Ethiopia, Ghana, Kenya, Rwanda and Zambia specifically to integrate and quality-control the automatic weather station data that does exist. That deployment is itself an admission of how patchy the record is.
AICCRA also names the operational reasons the network stays thin: high maintenance costs, a lack of local replacement parts, and mismatched data formats between station types. Those make it hard to keep even the existing stations running well. None of that is a Kenyan-specific figure. But the pattern it describes, urban and roadside bias, sparse rural coverage, maintenance drop-off, is exactly the gap an on-farm station is meant to close. A grower who sites their own station carefully is not competing with a dense national network; they are often the only instrument for kilometres in either direction. That is a different responsibility than siting a station inside a well-instrumented country.
A study of weather and climate information needs among small-scale farmers reinforces the same point from the demand side rather than the supply side. Farmers consistently want more localised information than the surrounding network can give them. A single well-placed farm station is one of the few ways to answer that demand directly, rather than waiting for a denser public network that has been shrinking, not growing.
What our own network shows about how much stations can disagree
NuaSense's own weather stations report air temperature, humidity, pressure, sunlight, rainfall, wind speed, gusts and direction roughly every ten minutes. The spread across our fleet over 31 July to 30 August 2026 makes the siting argument concrete rather than theoretical. Across 11 stations in Kenya, air temperature over that period ranged from 3.9 to 31.3 degrees Celsius, with a network mean of 17.3 degrees. Relative humidity averaged 72 percent but ranged from 17 to 100 percent. Rainfall totals across 8 stations over the same window ranged from 0.0 millimetres to 157.8 millimetres, station to station. Only 2.4 percent of ten-minute readings across the network recorded any rain at all.
That spread is not evidence of faulty instruments. It is evidence of what happens when real terrain, real exposure and real distance from obstacles sit under each mast. That is exactly the mechanism the sources above describe. A station tucked near a tree line or a wall will read a narrower, warmer, calmer slice of the farm than one standing in open ground, and the fleet-wide range above is the sum of eleven different compromises. Each one was made by whoever installed that particular mast. What this data is not: a network-wide spread across multiple farms over one recorded month, not a claim about any single station's location, which we do not publish.
Long-term satellite rainfall records over the same locations, from the CHIRPS product, show an average August rainfall of 52 millimetres across 43 years. The driest August was 24 millimetres in 1986; the wettest, 80 millimetres in 2025. CHIRPS is a gridded satellite-and-gauge product, not a farm gauge. It exists at a coarser resolution than any single mast. The gap between what CHIRPS reports for a location and what an individual gauge on that farm records over the same weeks is itself a siting argument: two instruments measuring the same rain, at different resolutions, disagree. The finer one is only trustworthy if it was placed with the rules above in mind.
Four siting options, and what each one actually costs
Framed as a decision rather than a rulebook, most Kenyan farms are choosing between four real options, not an ideal and a failure.
- Accept the compromise site next to the store or the boundary fence: cheapest, easiest to reach for maintenance, but wind and possibly rainfall readings carry a bias from the nearby obstruction that the Ask IFAS and Cornell rules describe, and you will not know the size of that bias without checking distances against the rules.
- Move the mast to the most open point on the plot, even if that means running cable or carrying the logger further: solves the wind and shading problems at the cost of convenience, and is the option every source above treats as the default recommendation where terrain allows it.
- Keep the compromise site for temperature and rainfall, since those need only four times the obstruction height, and accept that the wind reading specifically is unreliable: a workable split, given that Ask IFAS documents wind as needing ten times the obstruction height while temperature and rain need only four.
- Run a second station on a more open part of a larger property, or compare readings against a neighbour's, to see how far your compromise site actually diverges: the most expensive option in equipment terms, but the only one that gives you a measured answer rather than an assumption, in the same spirit as the fleet-wide spread NuaSense's own network shows above.
None of these is universally correct. A greenhouse operator running spray timing off leaf wetness duration and vapour pressure deficit has more to lose from a bad wind and humidity read than a farm using the station mainly for a seasonal rainfall record. The right answer follows from what the station's numbers are actually being used to decide. That is the same logic our products page describes for how sensor data turns into an irrigation or spray decision rather than sitting as a number on a screen.
Making the call on your own plot
Start by measuring, not guessing, the height of whatever stands nearest your candidate site: a fence, a windbreak, a shed roof, a mango tree. Multiply that height by ten to get the distance the wind sensor wants. Multiply it by four for the distance temperature, humidity and rain gauges want. Walk that distance out from every direction the obstacle could cast an influence, not just the one that looks obvious from where you are standing. If the site clears the four-times rule but not the ten-times rule, you have the split-decision case above: usable temperature and rainfall data, unreliable wind.
Check the ground under the proposed site and the sky above it separately. Bare compacted soil or a concrete pad underneath biases temperature warm. Any shading at any point in the day biases solar radiation, and by extension every derived figure, low. Neither of these shows up by looking at the mast itself. They show up by standing at the site at different times of day, watching where the shadows fall and what the surface underfoot is made of.
Where a farm runs soil probes and weather stations together, the siting question does not stop at the mast. The soil nodes uplink independently over LoRa roughly every ten minutes regardless of where the weather gateway stands. But the derived figures, ET0, vapour pressure deficit, spray window quality, all come from the weather station's own readings. A badly sited mast quietly degrades every downstream number. A farm uses those numbers to time a spray or an irrigation run. Our earlier piece is on siting fixes. It covers what to physically do once you have identified the problem. Those fixes cost an afternoon of labour. This piece is about knowing, before the mast goes up, which compromise you are choosing. And what it costs you in the numbers that come out the other end.
NuaSense has a longer piece on this: How to Increase crop yields in Kenya covers Kenya's crop yields are a fraction of what's possible. This guide covers the soil fixes, water strategies, seed choices, and precision tools. They are already making the difference for Kenyan farmers.