Buy a rain gauge and the advice you get is short: mount it in the open, empty it after rain, read the millimetres. That advice is not wrong. But it assumes a world where the gauge behaves the same in a drizzle and a downpour, where one reading stands for a whole farm, and where the mechanism never drifts. None of those assumptions survive contact with the research, or with what a decent weather station records over a season.
This piece works through where that common advice comes from. It looks at what conditions it was tested under, and where those conditions do not match a commercial block in Kenya. It draws on tipping-bucket trials, a gauge-density study, and measured data from our own weather stations deployed on farms here.
Measured by NuaSense weather stations and soil probes on Kenyan farms, over the period stated with each figure. Past readings, not a forecast.
The advice: any gauge in an open spot will do
Most extension guidance treats gauge type as a minor detail. The UF/IFAS Gardening Solutions guide recommends placing a rain gauge away from trees, buildings and irrigation lines. It also says to empty it after each rain. It notes that manual gauges with a 4-inch opening are quite accurate, while NOAA's own reference gauges use an 8-inch opening. That is a real, tested design choice, not folklore: bigger openings catch more drops and average out splash error.
Most automated gauges use a tipping-bucket mechanism. That includes the low-cost designs tested in a 2024 study developing experimental low-cost rain gauges. The researchers built two prototype tipping-bucket gauges, one 20 cm and one 28 cm in diameter, using Arduino and Raspberry Pi loggers. They ran them against a commercial ARG100 reference gauge during a real storm in Athens in September 2023. The bigger gauge tracked the reference within 6 percent. The smaller one drifted to about 10 percent variation, but only during the high-intensity intervals of the storm.
That single fact undercuts the idea that any gauge in an open spot is interchangeable with any other. Diameter matters. And it matters most exactly when rain matters most: during the intense bursts that do the damage to a field or a greenhouse gutter.
Where that assumption comes apart: intensity
The Athens storm reached intensities of 15 mm per 10 minutes, which works out to 90 mm/h. At that rate, the tipping-bucket mechanism itself becomes the limiting factor, not the diameter of the funnel. Every tip empties a small measured volume (0.221 mm per tip on the 28 cm gauge, 0.367 mm per tip on the 20 cm gauge in that study). During the fraction of a second the mechanism is tipping, water keeps falling and some of it is lost. The bias is not random. It runs one direction: undercatch, and it gets worse as rain gets harder.
The NEWA accuracy guide from Cornell puts a number on where this starts to matter. For commercial-grade gauges, tipping buckets noticeably underestimate storm totals once one-minute rain rates exceed 50 mm/h, when checked against a weighing gauge. A Rainwise tipping bucket carries a stated accuracy of 2 percent at 1.5 inches per hour. But that rating describes the instrument at a specific intensity, not a blanket guarantee across every storm.
Kenyan long rains and the short rains both produce storms that exceed 50 mm/h in bursts. This holds even if no long-term intensity dataset from a Kenyan station appears in the material here. The transfer is straightforward. A tipping-bucket total from a heavy afternoon storm at the coast or in the highlands should be read as a floor, not a precise figure. The heavier the burst, the more the true total sits above whatever the gauge reported.
Wind does the same thing from a different angle
Rain rarely falls straight down. Wind pushes it sideways past the collector, and both manual and tipping-bucket gauges lose catch to it. The Athens study and the Cornell guide agree on the mechanism if not an identical threshold: undercatch from wind becomes noticeable once wind speed at 2 metres height passes roughly 5 m/s, a little under 18 km/h, which is an unremarkable breeze on an open plot, let alone a ridge or an escarpment edge.
Cornell's siting advice follows from this directly: put the gauge somewhere protected in every direction but with good air movement, the kind of gap you find in an opening within a grove of trees, and keep the height of any nearby obstruction below twice its distance from the gauge. That rule was written for temperate orchard and turf settings. On a Kenyan flower farm or vegetable block with few trees and long open runs, satisfying it exactly may not be possible. The practical fallback is to accept that a gauge on an exposed ridge will undercatch during windy storms, and to treat its number as conservative rather than exact.
The advice: one gauge represents the farm
This is the assumption that does the most damage, because it is invisible until you have two gauges to compare. A PMC study on the effect of rain gauge density on rainfall accuracy found that correlation between gauge readings falls from 82 percent at 5 km spacing down to 21 percent at 40 km spacing, specifically for short-lived intense events: storms with a minimum hourly rate of 15 mm and a lifetime under three hours. Root mean square error over the same spacing range climbs from 8.29 mm to 51.27 mm.
The same study modelled a 50 km by 50 km area with eight gauges as the accurate baseline. Then it removed gauges one at a time. Dropping from seven gauges to one pushed the absolute error in areal rainfall from 15 percent up to 64 percent. Their finding: four to seven gauges over that area kept error small, while three or fewer produced significant error. Variability, they noted, is not abrupt within about 15 km of spacing. But it climbs sharply once gauges sit further apart than that.
A single farm gauge is a point measurement. That holds however well sited and well maintained it is. It tells you what fell at that funnel, in that ten-minute window. It does not tell you what fell on a block 3 km away across a valley, and the PMC numbers say that gap widens fast once the distance passes about 15 km. This is the argument made at more length in our earlier piece on why phone rainfall estimates and field gauges disagree, which worked through the same spacing problem from the satellite-estimate side rather than the gauge-network side.
What our own network shows about that spread
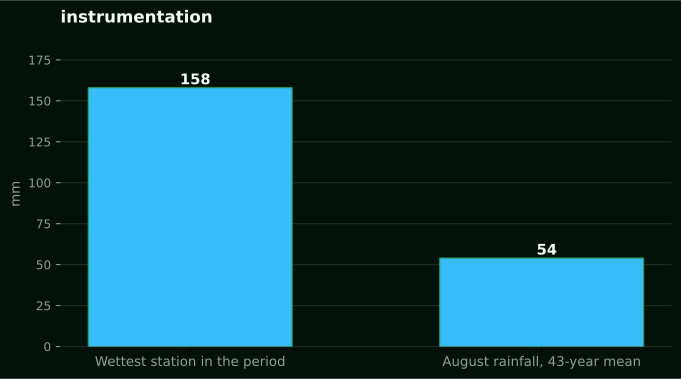
NuaSense weather stations recorded rainfall totals from 0.0 mm to 157.6 mm across eight stations. The period was three weeks, from 3 to 23 August 2026. That is not a typo. It is not one station malfunctioning. It is eight separate gauges on eight separate farms, and the spread between them over the same three weeks was that wide. It is a direct, measured illustration of the PMC finding: rainfall is patchy enough at farm spacing that no single number describes a region.
Across the same eleven-station network over a month, only 98 of 3,075 ten-minute readings carried any rain at all. That is about 3.2 percent. Most of the record is dry air between storms. That is exactly the pattern that makes a single burst disproportionately important. And exactly why undercatch during that burst matters more than any dry-period error ever will.
CHIRPS, the satellite-and-gauge rainfall product, put average August rainfall at the grid cells where our stations sit at 54 mm across 43 years of record. The range runs from a driest August of 26 mm in 1986 to a wettest of 83 mm in 2025. That is a long-run average. It is for a grid cell, not a forecast and not a substitute for what a gauge on your own block records this month. The 0 to 157.6 mm range measured this August across eight actual stations sits either side of that long-term figure. That is the point: climate averages describe the area, gauges describe the farm, and the two numbers answer different questions.
The advice: install it and forget it
Extension material rarely dwells on maintenance. The Cornell guide does, and the list is longer than most growers expect. Tipping-bucket gauges can drift out of calibration after two to three years in service, producing errors of 5 percent and possibly up to 10 percent. If a tipping-bucket gauge collects less than 90 percent of what a manual gauge alongside it collects, that is the signal of a clog, not calibration drift. The two problems need different fixes.
Random small readings appearing over time, without any weather to explain them, point to a clog. The alternative is the station swaying in wind and jostling the tipping arm. The opposite failure is an implausible spike, such as several inches of rain when none actually fell. It usually traces back to a failed reed switch. On networked stations, it can also trace to cross-communication from another station's signal. Cornell recommends cleaning at least once or twice a year. In debris-prone locations, more often, up to every three months. Wasps nesting in the funnel and birds perching and dropping seed are named specifically as recurring, unglamorous causes of bad data.
None of this is exotic troubleshooting. It is closer to servicing a pump: unglamorous, easy to defer. The reason readings go quiet or go strange is almost always mechanical, not meteorological. A farm manager who assumes a silent gauge means a dry spell, without checking the collector, is trusting an instrument. That instrument has already failed.
What this means for a probe network, not a single funnel
Our own weather stations use the same tipping-bucket principle. They count tips and convert them to millimetres at a per-tip volume calibrated per installation. That mechanism carries the same intensity ceiling described above. During a hard burst, the true rainfall total sits somewhat above what the counted tips report, because the bucket cannot empty instantaneously. We do not publish a plus-or-minus tolerance figure for the gauge. The honest answer depends on storm intensity and wind at the moment of the event. That is exactly what the Springer and Cornell material above describes, rather than a fixed number we could quote.
What a network does that a single gauge cannot is give you the spread, not a false precision. Eleven stations reporting a 0 to 157.6 mm range across three weeks is more useful to a farm manager with blocks in different microclimates than one gauge reporting a single confident number. The single number would have hidden exactly the variability the PMC study says exists at farm spacing. Soil probes on the same network report moisture at two depths every ten minutes. Reading rainfall and shallow soil moisture together tells you whether a recorded storm actually reached the root zone or ran off. A rain total alone cannot answer that.
Where satellite estimates fill the gap, and where they do not
For farms without a gauge at all, satellite rainfall products offer a workaround. Kenya has one of the more mature examples of this reaching smallholders directly. PlantVillage's precision agriculture work for smallholder farmers uses CHIRPS and Climate Hazards Group data at 5 km resolution to send SMS weather information through the iShamba service. That service reported over 500,000 users and 8.8 million messages sent during the 2022 Long Rains, at a running cost of about $1,800 for 350,000 messages a week. Of 4,272 farmers surveyed, 3,577 said the forecast SMS helped them. Most commonly, it helped them plant on time.
That is a large, cheap system. It is evidence that satellite-derived rainfall at coarse resolution has real value for farmers with no instrument at all. But 5 km resolution is still coarser than the spacing at which the PMC study found correlation between actual gauges dropping sharply. CHIRPS itself is a satellite-and-gauge blend, not a ground truth. It tells a farmer what an area is likely experiencing. It does not tell a farm manager what fell on block 4 versus block 7 this week. That is the resolution a commercial operation with several fields actually needs to decide where to irrigate next.
Reading a total, not a forecast
Everything in this piece describes what instruments recorded, not what is coming. A gauge, ours or anyone else's, tells you what fell in the past reporting interval. The CHIRPS long-run average for our stations' locations, 54 mm across 43 years of August records, is a historical mean, not a signal about this season. Treat any rainfall figure, from a bucket gauge, a network, or a satellite product, as a record of what already happened. Make the decision to irrigate or hold off from the current soil moisture reading and the current forecast-free rainfall total together. Do not make it from an assumption about what the season will do next.
That distinction matters more on a commercial block than on a garden plot. Misread a total there and the cost is a wasted irrigation cycle or a missed spray window, not a wilted flower bed. A connected sensor system covering both rainfall and soil moisture is built around exactly that discipline: gather what the instruments actually measured, apply the intelligence layer on top, and leave the guessing about tomorrow to someone else.
What to actually do with one gauge, or several
None of this argues against owning a rain gauge. It argues against trusting one gauge to answer questions it was never built to answer. A single well-sited gauge, cleaned on a schedule and checked periodically against a manual gauge for the under-90-percent clog signal, will tell you accurately what fell at that funnel. That is useful for irrigation scheduling on the block it sits on.
It cannot stand in for a second gauge on a second block. Nor can it answer whether a storm's true intensity exceeded what the tipping mechanism could register, or resolve whether the season overall sits above or below the local long-run average. Those three questions need, respectively, more instruments, an accepted intensity ceiling on the readings you already have, and a longer record than any one season provides. Kenyan commercial farms with multiple blocks or a mix of microclimates get more from several modestly sited gauges reporting honestly than from one expensive gauge treated as gospel.
The honest summary
The common advice, mount it in the open and empty it after rain, is correct as far as it goes, and comes from real testing on manual and low-cost tipping-bucket designs. It assumes moderate rainfall intensity, calm wind, a well-maintained mechanism, and that one gauge's reading can stand for a wider area. Kenyan storms during the long and short rains routinely exceed the intensity threshold where tipping buckets undercatch, and wind at ridge or escarpment sites regularly passes the 5 m/s threshold where undercatch begins. Add the farm sizes and microclimate variation here, and one gauge answers a much narrower question than growers tend to assume. None of that makes the gauge useless. It makes it an instrument with known limits. Knowing them is most of what turns a rainfall number into a decision worth acting on.