Date first, then number. When a month closes, the first week's job is to read the gauge. Everyone looks at the monthly rainfall total first. But on the page, that total tells you the least. Using our station and probe record from 04 September 2026 to 04 October 2026, and a Kisumu case from 2021, this piece shows what to put next to that total before you decide if the month was adequate or short.
Measured by NuaSense weather stations and soil probes on Kenyan farms, over the period stated with each figure. Past readings, not a forecast.
The window that has just closed
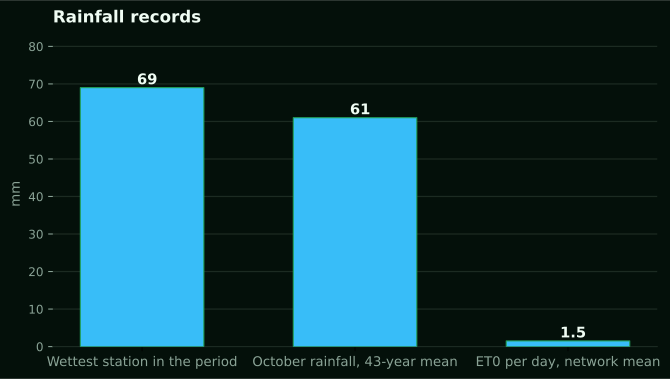
Our network record covers 04 September 2026 to 04 October 2026. In that time, totals at 4 weather stations ran from 0.4 mm to 68.9 mm. The stations do not sit together. So that spread is a measured gap between sites, not a number for the region. Still, it gives the first warning: two gauges in one network can tell you about two different months.
Out of 10,200 ten-minute readings, only 144 had any rain. That is 1.4 percent. Rain came as rare events in a mostly dry stretch. Say you get 60 mm. That total tells you nothing about whether those millimetres fell in one burst or in several soakings. That difference decides most of what follows.
Take this as a worked example of the method. It is not a verdict on any region. We do not name the farms where the stations sit. One station's record does not describe the county around it. What transfers is the method: gauge total, evaporative demand, starting soil water, and timing, in that order.
One more note: what we do not do. We report what instruments recorded over a past period. Nothing here tells you what the coming weeks will bring. Do not read the October comparisons later as a forecast of anything. They describe a record.
If you keep your own gauge, start by writing down the month's total. Also write the number of rain days and the largest single day. Three numbers beat one. The rest of this piece explains why, and what to pair them with.
What one millimetre is, and why that is only the start
The FAO chapter on rainfall and evapotranspiration puts the unit plainly. 1 mm of rain gives 1 litre of water to each square metre of field. A hectare then receives 10,000 litres. That is the volume that reached the ground. It is not the volume that reached the roots.
The same chapter defines effective rainfall this way: total rainfall minus runoff, minus evaporation, and minus deep percolation. Only water held in the root zone is usable by the plants. Your gauge measures the first term in that subtraction and nothing else. Every other term is a loss. You have to estimate it or measure it with a different instrument.
Plenty of growers miss this when a neighbour reports the month was fine. Fine at the gauge does not mean fine at the root zone. A total from a county advisory, a phone app or a bulletin tells you only about the top of the subtraction.
FAO does not say this. The 100 mm in a month and 150 mm in May are illustrations, not crop requirements. Do not lift them as thresholds for maize or anything else. No single millimetre figure is the requirement of a crop in the abstract. It depends on stage, soil and demand. That is why the next sections take them one at a time.
Evaporative demand: what the air took back
Our stations compute hourly reference evapotranspiration (ET0, FAO-56) using air temperature, humidity, sunlight and wind. From 04 September 2026 to 04 October 2026, it averaged 1.5 mm per day across 7 stations. Over the 30 days in that period, the arithmetic gives 45 mm (1.5 times 30) as a reference demand figure.
Treat that number with care. It is reference ET0, not crop water use. A crop at a given stage uses some fraction or multiple of it. We are not giving you that coefficient here because it is not in our bank. What ET0 does give you is a yardstick for the atmosphere's appetite over the same days the gauge was counting.
Put them side by side and the picture changes. One station logged 0.4 mm over the period, well short of 45 mm of reference demand. Another station sat at 68.9 mm, above it. Same network, same month, opposite readings against demand. The caveat: these are different sites with different conditions, so the comparison shows the method, not a ranking of farms.
Vapour pressure deficit tells the same story from another angle. It averaged 0.91 kPa across the network and peaked at 4.78 kPa. Those peaks are hours when the air pulls hard on leaves and soil surface. A light shower in such an hour can evaporate before it does any work. This is also where rain gauge records and station records meet. The rain gauges tell you what fell. The derived values tell you what the sky wanted back.
What the soil was holding on day one
Rain for the month lands on soil that already holds some moisture. The FAO chapter notes that infiltration rate is higher when the soil is dry than when it is moist. So the same shower fills a dry profile faster. On a wet one, it runs off more readily.
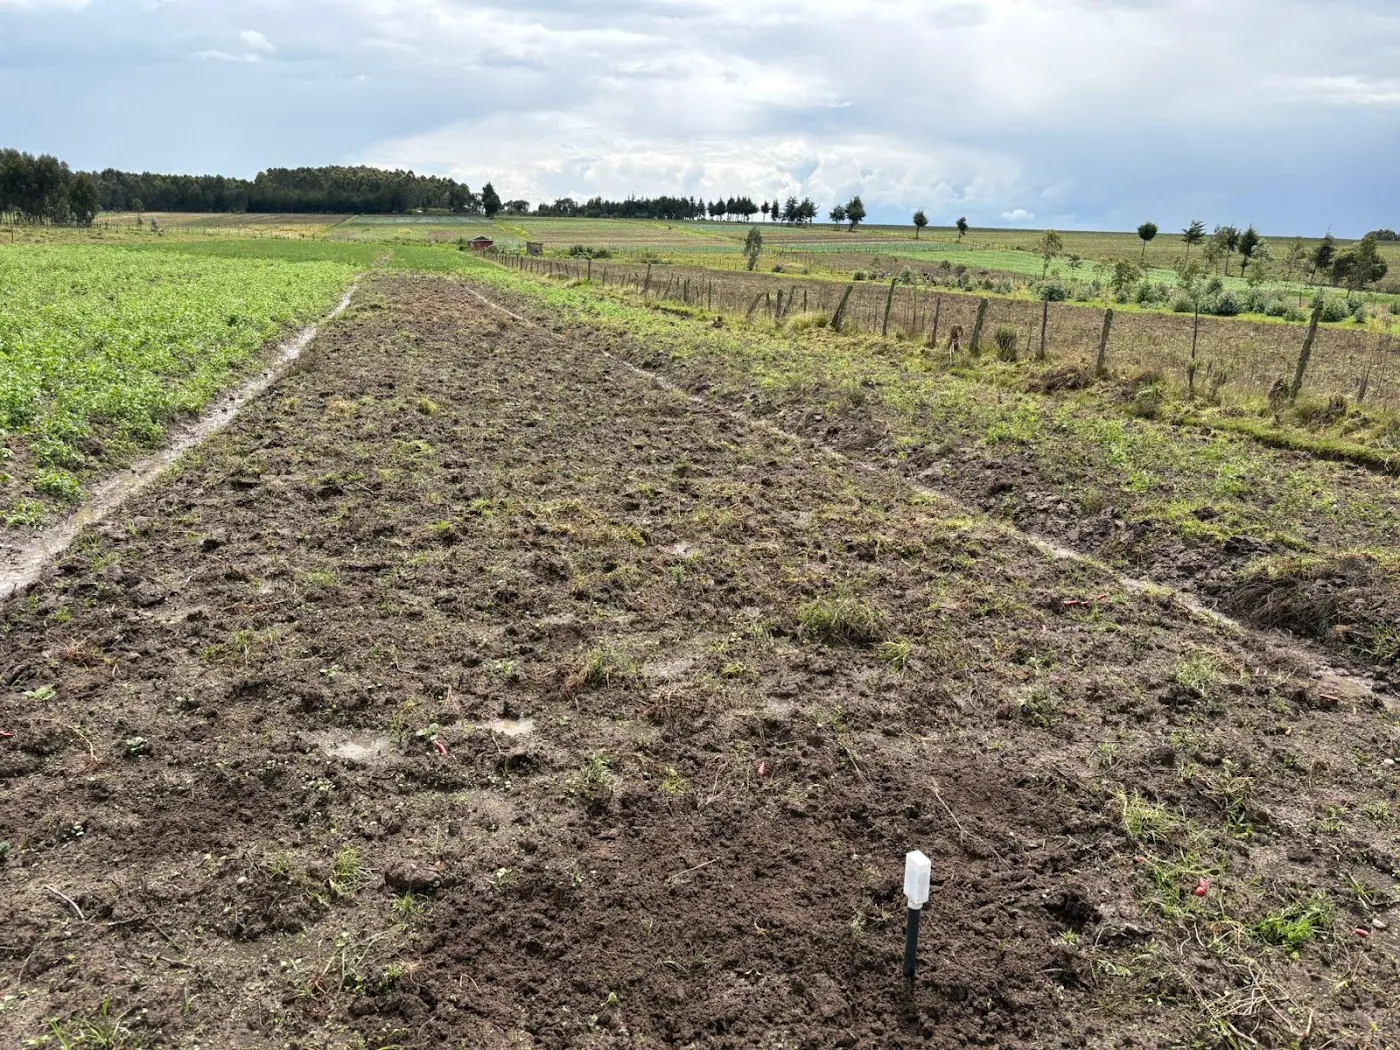
Our soil probes report relative moisture as percent of sensor scale, not calibrated volumetric water content. Across 2 probes over the period, the average was 78 percent of sensor scale. Most readings fell between 72 and 86 percent (10th to 90th percentile, both depths pooled). On this scale, 60 to 85 is normal. This is not a conversion to anything else, so do not treat 78 as a water fraction.
The probe record shows you the shape of things. Did the shallow probe rise after the rain days, then drop back within the week, while the deeper probe hardly moved? That tells you the month's rain wet the top layer and evaporated before it went down. Our earlier post on how deep the first rains wet the soil explained why the deeper probe needs more than a passing shower.
Two probes is a small sample. Don't dress it up. It just shows you the check. On your own block, write down the probe reading on the first day of the month and again after every rain day. That starting value is the missing piece in most monthly judgements.
Soil texture and slope change the same rain into different water
The FAO chapter splits soils into coarse and fine. In coarse soil, water goes in fast, but a big share drains below the roots. In fine soil, water goes in slowly, but more stays in the root zone. So the same shower can be mostly useful on one block and mostly lost on the next.
Slope also works against you. On steep slopes, effective rainfall is lower because water has less time to soak in. A farm with a steep upper block and a flat lower block gets two different effective rainfalls from the same gauge.
Where do you get texture? When a station first reports its position, our platform pulls modelled baselines (iSDA Africa at 30 m, and SoilHive from SoilGrids). These are map values from around 2016, not a soil test of that field. Use them to ask whether the block leans sandy or heavy. Then confirm with a spade and your own hands. Don't use them to compute a retention figure to the decimal.
Our bank has no Kenyan table that turns a gauge total into effective rain by soil type. We won't invent one. The honest way to build your own is to log gauge totals next to probe response on each block for a few months. After that, you'll have a record specific to your soils.
Fifty millimetres twice, or small showers all month
The FAO chapter gives a sharp example. 100 mm falling as two showers of 50 mm, one at the start of the month and one at the end, can leave the crop wilting in between and needing irrigation. The same 100 mm in regular small showers may need no irrigation at all. Identical monthly total, opposite outcome.
Intensity adds another layer. FAO compares 35 mm falling over 3.5 hours with the same 35 mm in one hour. It says the intense shower is less profitable to crops because it seals the soil surface, cuts infiltration, and increases runoff. Our post on rainfall intensity versus daily totals covers how to read the rate, not just the amount.
In practice, the tipping record from your gauge tells you more than the total does. The gauge counts each tip, turns it into millimetres using the per-tip volume it is calibrated for, and gives each tip a ten-minute timestamp through the station. Sort those tips by day and by hour, and you can see if the month came as a few bursts or as steady wetting.
In our own period, rain showed up in only 1.4 percent of readings, so the month leaned heavily towards bursts. That means a total, even a decent one, may have partly run off. This is an inference from the share of rain readings, not a measured runoff figure, so hold it loosely.
Kisumu 2021: 134 percent of April, and a lost season
The best Kenyan case in the record is the CABI analysis of Kisumu rainfall, built on five years of CHIRPS monthly estimates from January 2018 to December 2022. In 2021, the Kisumu weather station recorded 134 percent of its normal April rainfall. Then May 2021 came, and Kisumu rainfall collapsed to under 50 mm.
Kenya's May 2021 Crop Conditions Bulletin, cited there, reported that rains stopped early in mid-May in Lower Nyanza. At that point, maize planted in mid-March had reached the tasseling and dough stages. The bulletin projected normal yields for March-planted crops, but below-average yields for later-planted crops in Lower Nyanza.
Look at that closely. A wet April did not protect the late planting, because the rain stopped right when the crop needed it. April's monthly total looked superb, but it said nothing about mid-May. The source assigns no cause to what happened, and neither will we.
The lesson for your own record is about stage, not maize in general. Next to each month's total, write down the growth stage your crop was in when the rain stopped. A month's total is like a bank balance. The crop spends it on particular days.
The wettest months are the least dependable ones
The same CABI analysis shows something that cuts against a planting calendar. September has Kisumu's lowest monthly total on average, but all five years land close to the mean, so the driest month is the most dependable on record. May is the second wettest month on average and the last month of the March-April-May season. Even so, its rainfall is the hardest to predict from one year to the next.
The remainder component in the five-year decomposition swings by more than 200 mm, with no clear pattern. May 2021 is the single largest deviation. In most years, totals went above 350 mm in some months and dropped under 50 mm in others. The trend itself stayed in a narrow band of roughly 140 to 255 mm, with no long-term rise or fall.
Five years is a short stretch, and the analysis says as much: small shifts in July and January don't add up to a trend. Research across the Lake Victoria Basin has recorded growing intra-seasonal variability, delayed onset and more frequent dry spells, but this is Kisumu, not your farm.
Where surprises sit is what matters for your decisions. Don't stand down just because it's the rainy month. When the calendar says rain is certain, check the gauge more closely, because that is where the record shows the largest misses.
Where the advisory numbers come from, and how they err
A lot of the monthly totals you come across are not gauge readings. The UCAR Climate Data Guide on TRMM covers the TMPA 3B42 and 3B43 products at 0.25 degree resolution, from 1998 onward. The mission ran 17 years, to April 2015, and the analyses were set to stop production at the end of 2019.
The same guide says satellite products such as TRMM miss many light rain events, and the radar algorithm likely underestimates precipitation where convection is intense over land. It also notes that precipitation rate depends heavily on resolution in time and space, the source of the most common errors in processing and interpreting datasets. These are indirect measurements, not a replacement for a gauge.
CHIRPS, the product behind the Kisumu study and our long-term October figure, mixes satellite and station data. In the grid cells where our stations sit, October averaged 61 mm over 43 years (1983 to 2025), with a driest of 20 mm in 1996 and a wettest of 290 mm in 2019. That spread is huge, and it is a reference record, not our gauges.
So when a bulletin says the month was normal, ask which product, at what resolution, and whether your own gauge agrees. Our earlier post on why the nearest station does not describe your farm looks at the distance problem from the other side.
Why a clever model does not replace your gauge
A lot of machine learning work goes into monthly rainfall prediction, and it helps to know what it shows. A Frontiers study of monthly precipitation in Rabat, Morocco, using 1993 to 2018 data, found XGBoost the best of six single models at an RMSE of 40.8 mm. A stacked model cut that to 17.5 mm. The authors call rainfall one of the hardest variables to forecast.
An Ethiopian study of 92 stations found ANFIS beat ANN, with Nash-Sutcliffe values of 0.995 and 0.935. That work was in Ethiopia, built on longitude, latitude and altitude, and none of it was tested on Kenyan stations. Neither result should cross the border.
Take the best Rabat error, 17.5 mm. That is still a monthly error. It shows how far the model usually misses against a total. It tells you nothing about when rain fell during the month, and timing is what decided Kisumu 2021. Predicting a total, or estimating one, is not the same problem as judging whether the crop got what it needed.
Our job is narrower, and we stick to it. We do not forecast. We report what the instruments recorded. If you are deciding something about last month, a gauge on your own block, read against ET0 and the probe, beats any model of a total.
A dated routine for the next month's close
Put these on the calendar, tied to your own dates, not to ours.
- On the last day of the month, record the gauge total, the number of rain days and the largest single day.
- On the same day, read the shallow and deeper probe and write both against the first-of-month readings, in percent of sensor scale.
- By the third day of the new month, pull the month's computed ET0 from the dashboard and add it up as a reference demand, as we did above with 1.5 mm per day over 30 days.
- By the fifth day, mark the growth stage your crop was in on each rain day, and note any gap between rains that fell during flowering or grain fill.
- By the tenth day, compare your gauge with the bulletin or app total for your area and note the difference, so you learn how far that product runs from your block.
A NuaSense weather station goes for KES 30,000, and a soil sensor for KES 7,000. Both prices exclude taxes. The station works out ET0 from its own readings and puts the soil sensors online over LoRaWAN. Do you need one? That depends on how many blocks you run. If you have one uniform block, a manual gauge and a spade may be enough for the first season's learning.
NuaSense has a longer piece on this. Impact of climate change on crop yields in Kenya looks at how rising temperatures and erratic rainfall are affecting maize, tea and coffee yields. It also covers how tools like NuaSense and drought-tolerant seeds help farmers respond.
We also drew on the World Bank precipitation indicator for this piece. It gives annual precipitation depth in mm per year. No Kenyan value from it is used here.