A leaf does not know it is raining. It knows whether its surface is wet, and for how long. That distinction is the whole basis of leaf wetness disease risk models, and it is worth taking apart mechanically rather than treating as a single dial that runs from safe to dangerous. Each step below has a number attached to it, and the number is the part that actually decides whether a spore germinates or simply dries out and dies before it gets the chance.
Measured by NuaSense weather stations and soil probes on Kenyan farms, over the period stated with each figure. Past readings, not a forecast.
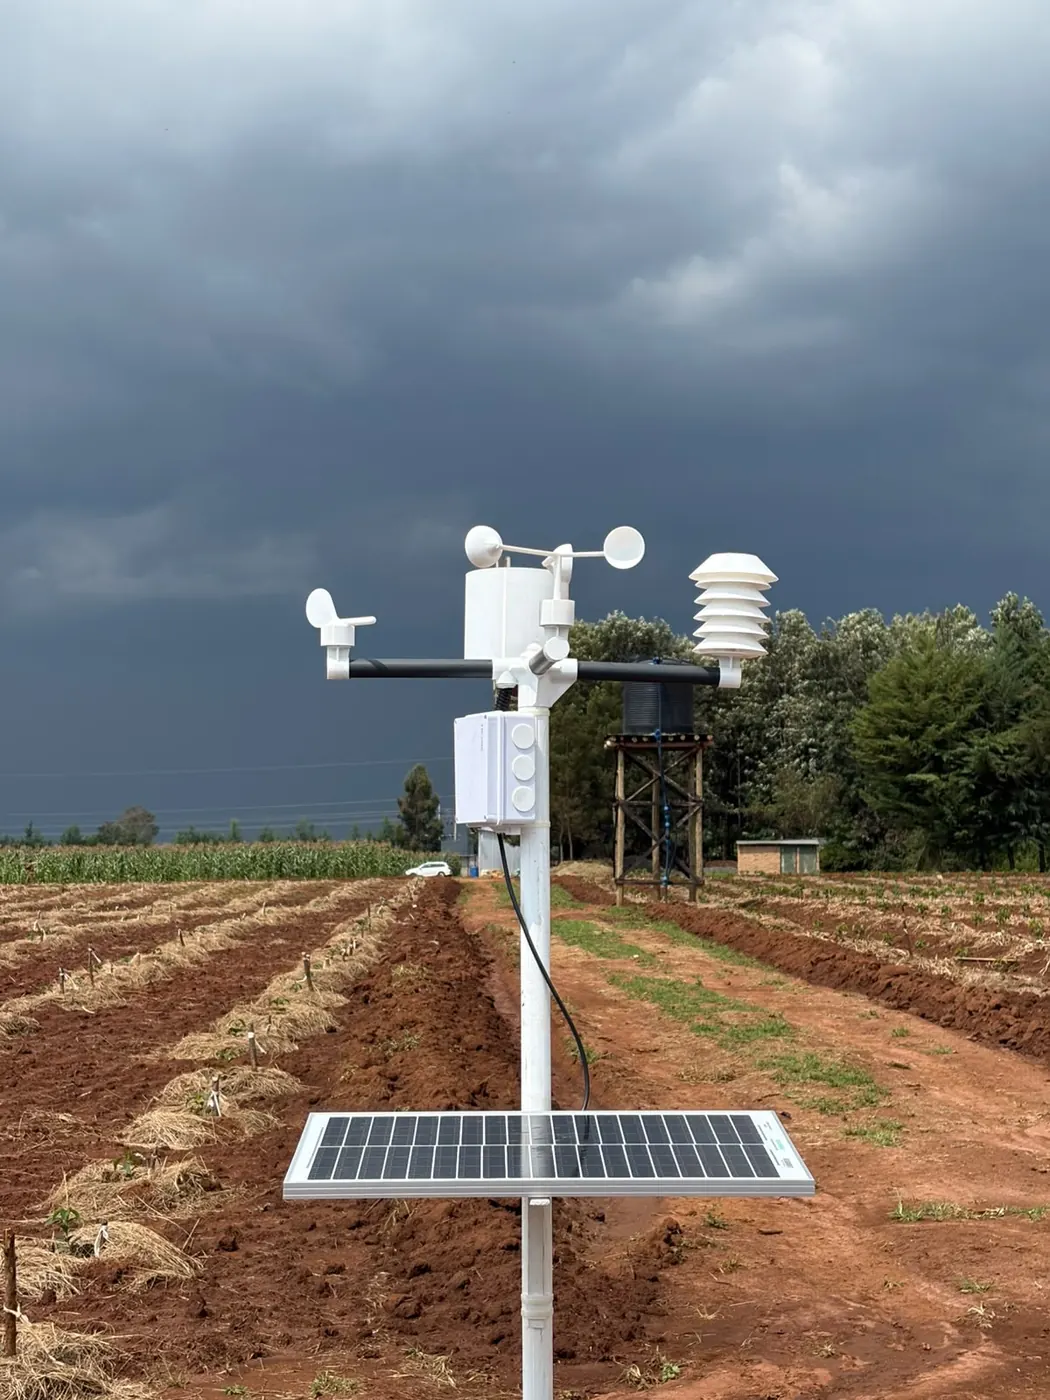
Midnight to eight builds most of the wet hours
Dew is not rain and it behaves differently, but it counts the same way toward a wetness sensor. The Mississippi State Extension guidance on watering and plant disease puts dew on plant surfaces from roughly midnight to eight in the morning, which means a large share of any day's wet hours accumulate before a farm manager has walked the block at all. Overhead irrigation run at the wrong hour adds directly onto this window rather than opening a separate one: watering as dew is forming, or as it is drying, only extends the same clock the crop is already running against it. That is a scheduling decision, not a hardware one, and it costs nothing to fix once the window is understood. A farm that irrigates at five in the afternoon and again before sunrise is, without meaning to, manufacturing two extra hours of wet leaf on top of whatever dew would have formed anyway. The Mississippi State guidance is explicit that the fix is timing, not volume: watering deeply and less often, and finishing before dew begins to form in the evening, shortens the wet period without changing how much water the crop receives.
A film of water behaves like a lake to a spore
Once a leaf surface carries free water, whether from dew, fog, mist or rain, most fungi, bacteria and aerial nematodes need that film to move and infect at all, according to the University of California nursery and flower grower guidance on leaf and flower wetness. A spore sitting on a dry leaf is dormant. The same spore on a wet leaf can swim, germinate, and push a germ tube through a stoma or a wound in the cuticle. This is why leaf wetness duration, not total rainfall, is the input every serious disease model actually uses: five millimetres of drizzle that keeps a leaf wet for six hours matters more, mechanically, than fifteen millimetres that falls in twenty minutes and dries by noon. A rain gauge cannot tell the two apart. A wetness sensor can, because it is reading the surface state directly rather than inferring it from how much water fell.
Nine hours is the number that keeps showing up
The Mississippi State guidance states plainly that many fungi require a film of free moisture for at least nine hours to germinate and penetrate the leaf, and that the amount of disease that follows depends on both the number and the length of these wet periods across a season, not any single event. That nine-hour figure is a mechanism threshold, not a Kenyan-crop rule, and it will not be identical for every pathogen or every crop it is tested against. But it explains why a wetness sensor reporting hourly is more useful than a rain gauge reporting daily totals: the gauge tells you it rained, the sensor tells you whether the wet period actually crossed the line a spore needed to complete its work. Two days can carry the same rainfall total and produce entirely different disease pressure, because one strung its wetness into a single nine-hour block and the other broke it into three separate two-hour showers that each dried before the fungus finished its work.
What our own network recorded through this stretch
Across five NuaSense weather stations over 07 August to 06 September 2026, 26 percent of station-hours were recorded as leaf-wet, which works out to about 6.2 hours in an average day. That sits below the nine-hour figure Mississippi State cites for many fungi to complete germination and penetration in a single wet event, but it is an average across the whole record, and averages hide exactly the days that matter. A day sitting at four wet hours and a day sitting at eleven wet hours can both average out to 6.2, and only the second one crosses a real infection threshold for a fungus needing the full nine. This is the argument for reading the daily figure rather than the monthly one when a spray decision is actually on the table: the monthly average tells you the season has been moderate, the daily record tells you whether last Tuesday was the day the disease got its foothold.
Humidity does the work once the leaf itself has dried
Free water is not the whole story. Many fungi need high relative humidity to produce spores in the first place, even once the leaf surface itself is dry, according to the same UC guidance. Across the network over the same period, mean relative humidity ran at 69 percent, with a range from 17 to 100 percent across 11 stations. That range matters more than the mean: a station spending long stretches above 90 percent humidity is carrying spore-production conditions well past the point where the leaf itself has stopped feeling wet to the touch, and a wetness sensor alone would miss that entirely. A grower reading only the wetness channel and ignoring the humidity channel is watching one half of the infection cycle: the half where a spore lands and germinates, and missing the half where the next generation of spores is being manufactured on an already-dry canopy.
18 to 24 degrees is where wetness turns into infection, for one named disease
None of this matters without a temperature window the pathogen can actually use. The Bayesian and machine-learning study of coffee leaf rust across six Kenyan counties, built on 9,850 plot-level observations collected by the Coffee Research Institute within KALRO between 2018 and 2023, found that leaf wetness exceeding ten hours together with relative humidity above 75 percent sharply raised infection probability, and that the disease develops fastest between 18 and 24 degrees Celsius. Our own network's air temperature averaged 17.7 degrees over the record, sitting at the cool edge of that rust window rather than in the middle of it, which is a reminder that this threshold is specific to coffee rust and to the counties it was measured in. It is not a general rule for every leaf disease, and applying it to a different crop, or even to a coffee block at a different altitude, without checking is exactly the kind of transfer error that turns a real finding into a false confidence.
Six counties, one model, and why the county mattered
The rust study covered Bungoma, Kericho, Kiambu, Kirinyaga, Murang'a and Nyeri, and its Bayesian hierarchical layer was built specifically to account for unobserved heterogeneity between those counties rather than pooling them into a single national figure. That structure matters for anyone reading disease guidance from a single trial: county-level differences in altitude, canopy management and microclimate change how the same wetness and humidity numbers translate into risk. A model built on six named counties gives you a method worth copying, not a number you can transplant onto a seventh county the study never covered. If a farm sits outside those six, the honest reading of this paper is that the mechanism (wetness plus humidity plus temperature) still applies, but the specific thresholds have not been tested there, and a grower should treat the ten-hour and 75-percent figures as a starting hypothesis rather than a settled cutoff.
The plain model beat the complicated one
The same study found logistic regression, a comparatively simple statistical method, reached an AUC ROC of 0.867 for predicting rust incidence, and that random forests scored only slightly higher while being far harder to interpret. For a resource-limited extension service, the paper's own conclusion was that the interpretable model performed competitively with the more complex one. That is a useful data point for anyone being sold a black-box disease algorithm: the added complexity did not buy much accuracy, and it cost all of the transparency a field officer needs to explain a warning to a farmer. If a Kenyan input dealer or extension office wants to build a rust flag from a wetness and humidity feed, the plain model is not the compromise choice, it is close to the best one available, and it is the one a technician without a machine-learning background can actually audit when it gives a wrong answer.
Drought can suppress a disease that wetness usually drives
Not every leaf disease behaves the same way under stress, and this is where the mechanism gets less tidy. The Springer study of Ramularia leaf spot in barley found that leaf wetness extent and duration were key drivers of the epidemic, exactly as the coffee rust and Mississippi State findings would predict, but it also found that continuous drought stress suppressed the disease under field conditions. That is a genuinely different result from the wetness models above, and it is worth sitting with rather than smoothing over: a crop under water stress may show less disease pressure even as its wetness sensor readings would otherwise flag risk, because the fungus in that study needed a healthy, actively growing host as much as it needed a wet leaf. The barley trial was run in Europe, on a different crop, and nothing in it licenses a Kenyan grower to assume drought protects every crop against every wetness-driven disease. What it does license is scepticism toward any rule that treats leaf wetness as the only variable that matters. Host condition sits underneath the wetness number, and a stressed crop does not always respond to a wet week the way a well-watered one does.
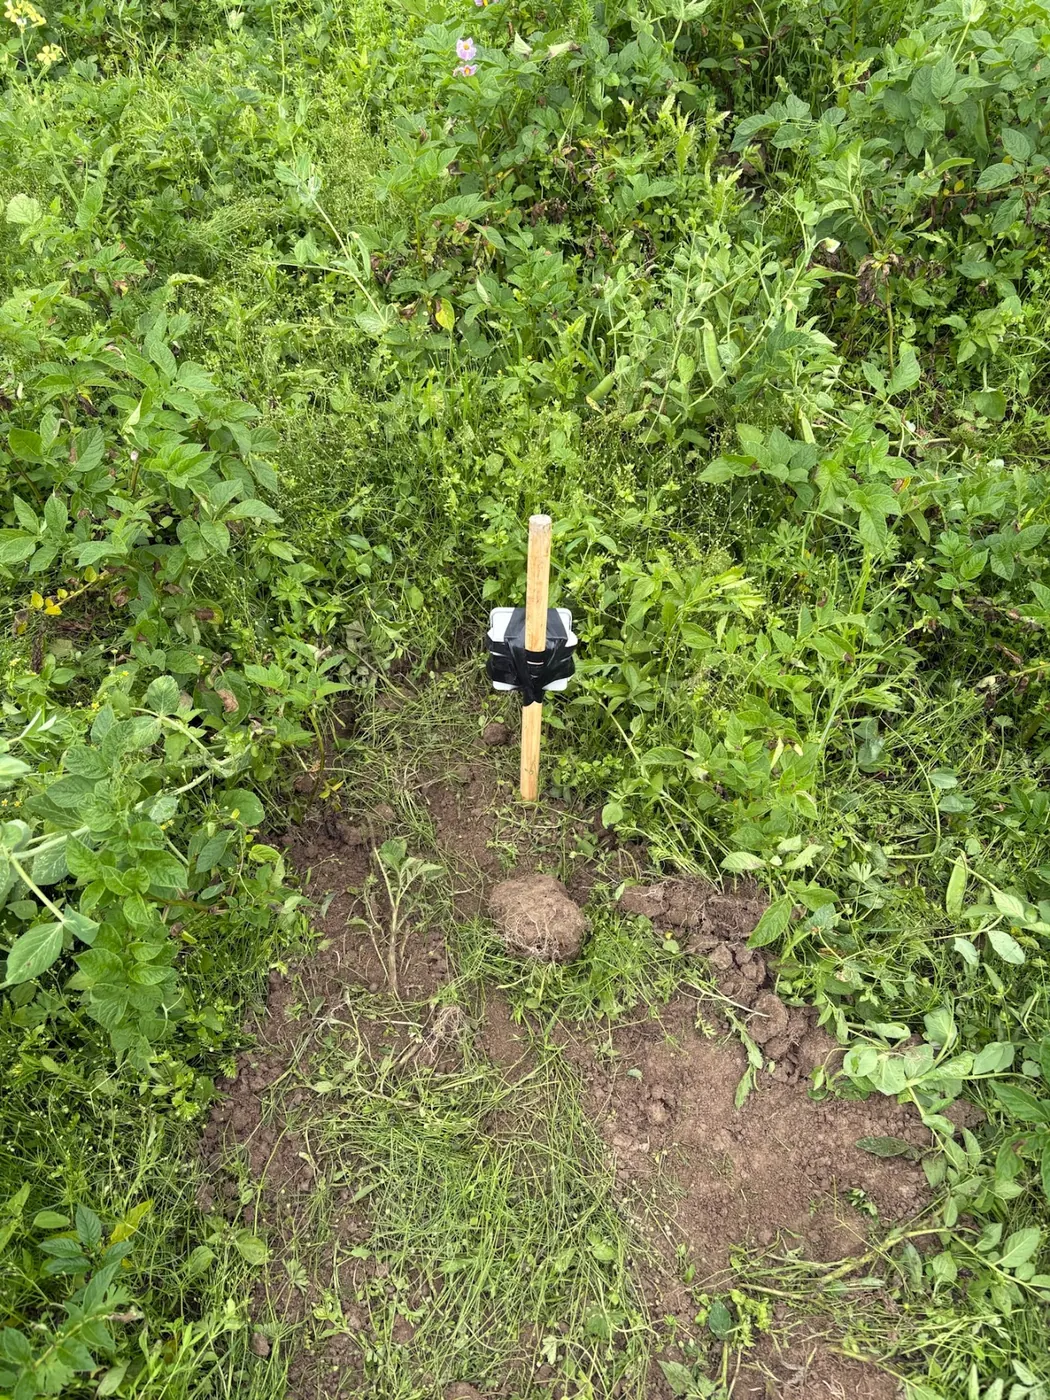
Wetness sensor or humidity proxy, and the trade-off between them
A dedicated leaf wetness sensor measures something closer to the actual mechanism: a surface that mimics a leaf, wetted and dried by the same conditions the crop experiences. Relative humidity sensors are offered by the UC guidance as an alternative input to disease prediction models, and they are considerably easier to calibrate and maintain over a season. The trade-off is real: humidity is a bulk air measurement and will miss a leaf that stays wet under dense canopy after the surrounding air has already dried out, which is common in a well-grown coffee block or a greenhouse rose crop, the exact case the UC guidance cites for grey mould severity rising with wetness duration. A farm choosing between the two is choosing between mechanistic accuracy and ease of upkeep, not between a good sensor and a bad one, and the right choice depends on how dense the canopy gets and how much time someone has to walk out and check a sensor mid-season.
Getting the physical sensor wrong is easy, and common
The University of Florida IFAS guidance on leaf wetness sensor problems sets installation at 30 centimetres height, angled 30 to 45 degrees from horizontal, facing north in the Northern Hemisphere, and states plainly that getting the height or orientation wrong produces inaccurate risk predictions, not just noisier ones. It also lists ordinary field failures: paper sensors with damaged or missing paper, and herbicide spraying that kills the grass a sensor was calibrated against. Researchers pair sensors for exactly this reason, because a single unit failing silently looks identical, on a dashboard, to a genuinely dry week. On a Kenyan block where a sensor might sit unvisited for weeks between site checks, that silent failure is the more dangerous mode, worse in practice than an obviously broken unit that at least stops reporting altogether. A grower who trusts a badly angled or grass-starved sensor is not getting a rough answer, they are getting a confident and wrong one, and there is no way to tell the difference from the dashboard alone.
What the spray window score actually compresses
Our own weather stations compute an hourly spray window quality score from 0 to 100, built from the same station readings as leaf wetness and humidity. Over the record, 19 percent of station-hours scored 60 or better and 52 percent scored below 30, a distribution weighted toward poor spray conditions rather than good ones. That is not a rust forecast and should not be read as one: it reflects wind, humidity and wetness together, and a low score can mean wind risk to drift as easily as it can mean standing leaf moisture. Reading it alongside the weather station data for a specific disease threshold, rather than as a single traffic light, is what keeps the number honest. The pesticide application guide covers the spraying side of this decision in more depth, including timing a spray against weather conditions rather than the calendar, which matters as much for fungicide efficacy as it does for drift control.
Baseline surveys exist for a reason, and this is it
None of the thresholds above arrived pre-packaged for East Africa. The CABI baseline survey on emerging pests and diseases in eastern Africa exists precisely because the region's disease pressure has not been mapped county by county the way the coffee rust study mapped six specific counties. A leaf wetness and humidity record from a farm's own weather station is useful raw material for exactly this kind of local mapping work, whether that is a formal survey or a grower simply keeping their own log of wet-hour totals against the disease outbreaks they actually see. Without that local record, a farmer is stuck applying a threshold measured somewhere else and hoping the transfer holds. With it, they at least have the option of checking whether ten hours of wetness and 75 percent humidity means the same thing on their block that it meant in Kirinyaga.
Where the record breaks down
None of this chain is as clean as it sounds once you get to a working farm. A wetness sensor sited badly, as the Florida guidance describes, generates a confident-looking number that is simply wrong, and a farm manager acting on it is worse off than one working from no sensor at all. A humidity proxy misses canopy-level wetness that lingers under dense growth after the surrounding air reads dry. The coffee rust model itself, however strong its AUC, was built on six specific counties and a specific crop, and reading its 18 to 24 degree window onto a different disease or a different altitude band is the transfer error this whole piece has tried to flag rather than commit. The Ramularia finding is a reminder that host condition can override a wetness signal in the opposite direction to what most models assume. Siting the physical instrument correctly, which the weather station siting guide covers in more depth, matters as much as anything downstream of it: a well-built model fed a badly placed sensor still produces a wrong answer, just a precise-looking one. The honest position is that leaf wetness and humidity give real lead time on real thresholds, in the six counties and the one disease where that threshold has actually been measured, and a rough proxy everywhere else until someone runs the same study on your crop and your county.