Measured by NuaSense weather stations and soil probes on Kenyan farms, over the period stated with each figure. Past readings, not a forecast.
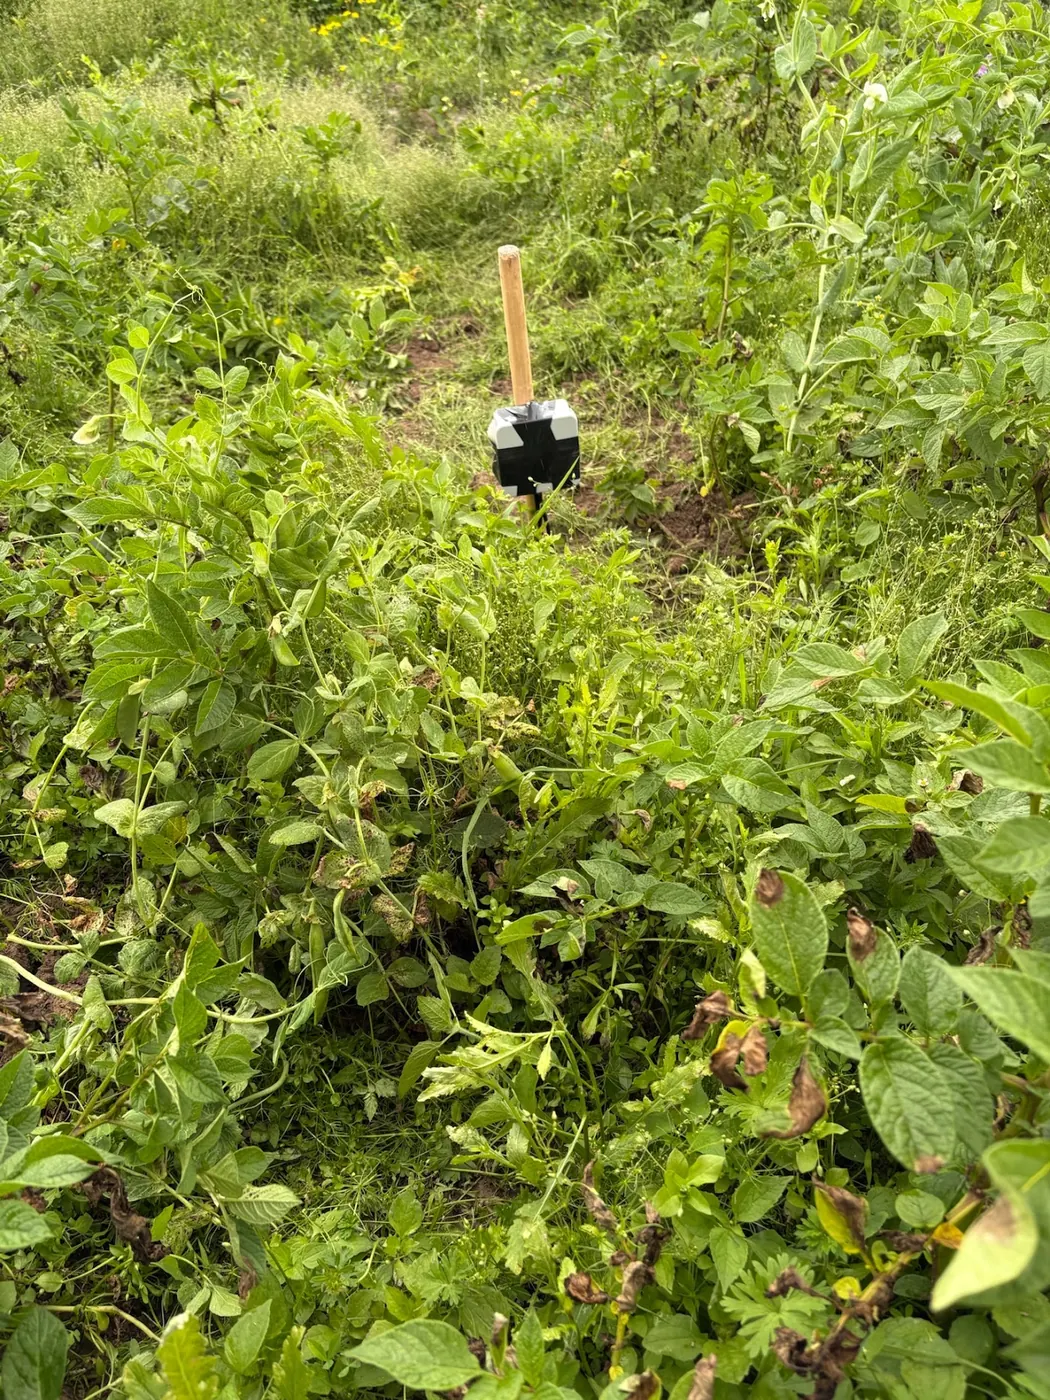
One row, six physical processes
An automatic weather station doesn't draw a continuous trace. It writes a row. On the NuaSense design, a new line arrives every ten minutes with air temperature, humidity, air pressure, sunlight, rainfall in millimetres, wind speed, gust and direction. Six rows an hour, 24 hours a day, gives 144 rows daily, and between 11 September and 11 October 2026 our seven stations built a database out of nothing else.
This article pulls one of those rows apart, field by field. A phone screen shows a humidity figure, a zero for rain, a number for wind. Behind each one is a different process and a different way to go wrong. Rain is counted, tip by tip. Wind is counted too, as pulses from a spinning cup. Temperature comes slowly from a sensor inside a shield. Sunlight is an electrical signal. Some numbers on the dashboard are not sensed at all: they are worked out afterwards from the raw ones.
Every section has one number that governs it, taken either from a published source or from our own network over a stated period. If nobody has published a figure for Kenya, the text says as much. Everything here measures what already happened. A row contains no forecast.
Ten minutes is a choice made upstream
Look through the sources for a ten-minute interval and you will not find one. The AICCRA report on real-time weather data says automated stations can measure every fifteen minutes and send the readings to a meteorological office. Traditional stations, by contrast, needed staff visits, sometimes several times a day. That report also describes aggregation at hourly, daily, 10-daily and monthly intervals. The Climate Hazards Center's East Africa special reports work in dekads and refresh their plots every dekad. Ten minutes appears in none of these.
So ten minutes is a design decision. Ours is roughly ten minutes, for both the weather and the soil sensors reporting through the same mast. A shorter interval catches a brief shower or a gust that a longer interval smears into the rows around it. A longer interval saves power and data. But no interval recovers detail it threw away. Once a row is a count, a mean or a peak, the shape inside the ten minutes is gone.
Every comparison across sources crosses intervals, whether it says so or not. A fifteen-minute network figure, an hourly dashboard figure and a dekadal rainfall total are different objects. Before you compare two numbers, ask what interval each one was built over. Then ask whether it is a sum, a mean or a peak.
Rain: a bucket that counts tips
The rain gauge is the simplest sensor on the mast, and the one most often misread. A tipping-bucket gauge catches rain in a small seesaw. When one side fills, it tips, empties, and the other side starts filling. The station counts the tips and converts them to millimetres using the per-tip volume that gauge is calibrated to. We do not publish a millimetres-per-tip figure, because it is a per-installation calibration. Do not quote one from a brochure.
So the ten-minute value is a count, multiplied up. Between 11 September and 11 October 2026, 185 of 10,985 ten-minute readings across our network recorded any rain at all, which is 1.7 percent. The other 98.3 percent of rows carry a zero. A rain record is mostly nothing, broken by short events, so a zero is the default and says very little.
A zero means one of two things: dry, or blocked. According to the University of Florida IFAS guide to farm weather station installation and maintenance, the problem rain gauges run into most often is the catchment funnel clogging with insects, turf clippings and dirt. The same guide says check it weekly, or more often. A clogged funnel gives no warning. It reports a quiet season.
Site totals vary too. Over that month, four of our stations came in between 0.4 mm and 76.4 mm. Those stations are not co-located, so the gap is between places, not a regional figure. For context only, the CHIRPS satellite-and-gauge record for the grid cells where our stations stand averages 61 mm for October across 43 years. Its driest October was 20 mm in 1996; its wettest was 290 mm in 2019. CHIRPS is not our gauge, but it shows how wide the normal range is.
Wind: pulses, a conversion, and a peak
The wind sensor is a rotating anemometer. The cups spin, the station counts pulses, and that count over the interval is turned into a speed. So the speed in your row is an interval value made from a count, not a snapshot of one moment.
The gust works differently. It is the peak within the reporting interval, so it is neither an instantaneous reading nor an average. Two rows can have the same mean speed and still show very different gusts. The mean tells you how fast the air moved over ten minutes; the gust tells you how hard it pushed at its worst. Direction comes alongside, so you can tell a steady wind from one that has swung.
What decides quality here is the surroundings, not the cup. The FAO annex on measuring and assessing the integrity of weather data says anemometers are always placed at not less than 2 m above the ground, and often at 5 m following WMO recommendations. It also says accuracy depends on the upwind fetch as much as on the instrument. That means you need a large fetch with no buildings and trees in the way. A good anemometer stuck behind a row of eucalyptus will report the lee of the eucalyptus.
Our earlier post on weather station siting, height and exposure goes through how much clear ground each sensor wants. If you must compromise the siting of one sensor, do not let it be this one. No later arithmetic adds the missing fetch back.
Air temperature: a slow sensor in a shield
Air temperature looks like the simplest number in the row, but where the sensor sits affects it more than any other reading. The sensor measures its own temperature. That equals air temperature only when the sun and ground are not heating it. That is why you need the shield. The FAO annex says temperature sensors sit in naturally ventilated radiation shields, and are occasionally artificially aspirated to reduce biases from heat loading by the sun. It also says thermocouples need an additional base temperature reading, normally from a thermistor.
Across seven NuaSense stations, between 11 September and 11 October 2026, air temperature ranged from 6.0 to 36.7 °C, with a mean of 19.8 °C. That range is pooled. It is the coldest single row and the hottest single row anywhere in the network, not what one farm experienced.
We publish no accuracy figure for our hardware. For a benchmark of what a medium-cost station usually gives, the UF/IFAS guide puts air temperature sensors at plus or minus 1°F across their whole range. That 1°F gap equals 5/9 of a degree Celsius, or about 0.56 °C. For a frost or heat-stress threshold, that margin matters, and it comes before siting errors enter the picture.
That same guide wants temperature and humidity sensors over an open, level area at least 10 m across with short grass cover. They need to be at least four times the height of any nearby obstruction away, or at least 30 m from large paved areas. Concrete yards, iron roofs and tarmac push heat into the reading. Next to a wall, the number is real, but it describes the wall.
Humidity, and the stretch above 90 percent
Relative humidity compares the water vapour in the air with what the air could hold at that temperature. That is why it swings through the day even when the vapour barely moves. At our seven stations, over the same month, it averaged 69 percent and ranged from 18 to 100 percent.
The sensor is least trustworthy at the top of that range. For a medium-cost humidity sensor, the UF/IFAS guide gives typical accuracy of plus or minus 3 percent below 90 percent RH and plus or minus 4 to 5 percent above 90 percent. It warns that the weaker accuracy above 90 percent becomes a problem when humidity feeds a mathematical model used to estimate leaf wetness duration. Here is the awkward truth for leaf wetness and disease risk: the model needs its best data right where the sensor gives its worst.
A reading of 100 percent can mean more than one thing. It can be saturated air at dawn, which is real and ordinary. It can be a sensor wetted by dew or drizzle and slow to dry. It can also be a sensor that has stopped responding and sits at its ceiling. One row cannot tell those three apart. The pattern can. Real saturation builds toward the cold hours and falls after sunrise. A pinned sensor sits at the ceiling through a hot, dry afternoon.
We compute leaf wetness duration from the station's readings. Across seven stations, 25 percent of station-hours were recorded as leaf-wet. That is about 6.0 hours in an average day, a quarter of 24. The humidity error carries forward into that number. If a fungicide programme hangs on it, treat the duration as an estimate with a wide shoulder, not a measurement of the leaf.
One cheaper alternative is worth naming. If your question is only whether the night was wet, a dawn walk through the crop tells you more than a humidity number whose error margin is at its widest. The sensor earns its place when you need the record across many nights and several blocks.
Sunlight: the sensor with a hidden limit
Sunlight feeds the evaporation calculation later, so it helps to know what sits behind it. The FAO annex describes the common glass-domed pyranometer. A thermopile measures thermal gradients across hot and cold sensing areas, black and white, and radiation intensity is proportional to the temperature difference between them.
The silicon diode pyranometer is the cheaper choice. According to the annex, it costs less and puts out an electric current that tracks solar intensity. But it is not fully sensitive to the full spectrum of visible light. That means its calibration holds only for upward solar measurements. In heavy cloud, or when the light comes from another part of the spectrum, you cannot count on the reading to track.
Sunshine duration is another thing altogether. The annex says the Campbell-Stokes heliograph is the usual way to record it. The instrument burns a trace onto paper through a glass globe. It has to face south in the northern hemisphere and north in the southern hemisphere, and rain water must not collect on the paper. Hours of sunshine and radiation intensity are not interchangeable. A number labelled sunshine on a phone could mean either one. Dust or bird droppings on a dome slowly weaken the signal. A slow loss can look like a cloudier season.
ET0: four raw numbers, one derived one
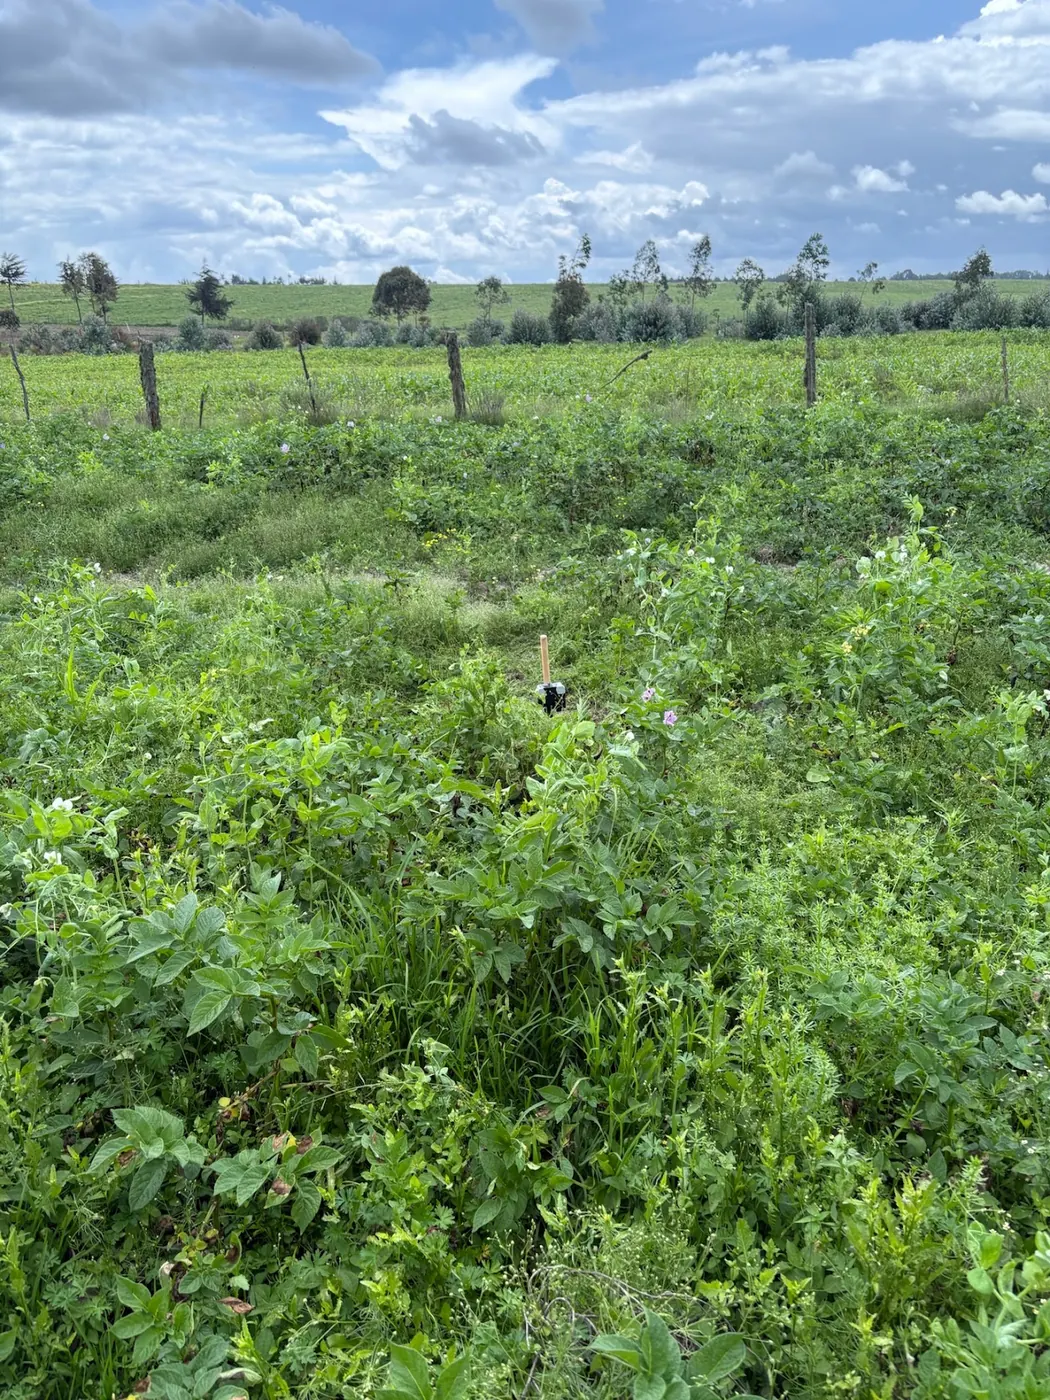
Reference evapotranspiration, ET0, is the first number in the row that no sensor reads directly. At the station, hourly ET0 is computed with the FAO-56 method. It draws on temperature, humidity, wind and radiation. The University of Arizona Cooperative Extension grower's guide notes that relative humidity is one of several parameters used to estimate reference evapotranspiration. So where humidity is measured can shift local irrigation decisions.
From 11 September to 11 October 2026, ET0 averaged 1.6 mm per day across our seven stations. This is reference ET0. It is a standardised estimate of what a short, well-watered grass surface would lose to the air. It is not what any crop used. A crop shows up here only as the reason for the number: someone is comparing it with a rainfall total.
The danger lies in the chain. A fault in any of the four inputs runs straight into ET0 and comes out as a clean decimal. The FAO annex is blunt. Estimates of ET0 are only as good as the weather data behind them. Integrity and quality must be checked before the data enter the equations. The annex adds a rule worth pinning on the office wall: no data are better than bad data. If you have no local data, you can fall back on regional weather or ET summaries. If local data are biased or faulty, you are stuck with the figures that result.
Read the four inputs first, then read ET0. If humidity has been pinned high, if the dome is dirty, or if the anemometer has stopped, the derived number deserves no trust. It does not matter how many digits it shows.
Dew point, vapour pressure deficit and the spray score
Dew point is computed here, not sensed. The FAO annex explains why. It is often measured with a mirrorlike metallic surface that is cooled artificially, and the temperature at which dew forms on it is read as Tdew. Other dew sensors rely on chemical or electric properties of materials that change when they absorb water vapour. The annex says these instruments are seldom available in weather stations because they need careful operation and maintenance. Ours calculates dew point from temperature and humidity, so it inherits their errors.
Vapour pressure deficit, VPD, is also derived from temperature and humidity. It measures how much drier the air is than saturation, in kilopascals. Across seven stations, it averaged 0.94 kPa and peaked at 4.78 kPa. That peak is one computed hour at the hot, dry end. It is not a typical afternoon.
The station works out a spray window quality score each hour, using its own readings, on a scale of 0 to 100. In that month, across seven stations and 5,000 station-hours, 18 percent scored 60 or better, while 56 percent scored below 30. That means most hours were poor. Before you rely on a good score, look at the raw wind and humidity.
Why a borrowed reading is not your farm
Citing WMO (2008), the Arizona guide says weather data is most reliable within a 60-mile radius for large-scale weather patterns. For local uses, such as precision farming, it says within 6 miles. Near Gila Bend, it compared relative humidity from one device with the nearest state network stations at 15, 27 and 41 miles, over 12 to 19 February 2025. Those are distances in the American desert. No Kenyan equivalent appears in the sources. A ridge, a lake shore or an irrigated block can make two points behave differently even when the 6-mile rule calls them neighbours.
Public networks in Kenya are fragmented too. The Kenya Meteorological Department has had a hard time managing up to seven different automatic station networks. The Climate Hazards Center pulls 90-plus extra stations from Ethiopia, Kenya and Somalia into its rainfall estimates every dekad. Those include readings from the 3D-printed automatic stations built by KMD.
Our own kit, for the record: a NuaSense weather station costs KES 30,000 and a soil sensor KES 7,000. Both prices exclude taxes. The station runs on solar power and gets online through a Safaricom SIM or Wi-Fi. The data fee is passed on at cost, usually about one US dollar per station per month. The soil probes send a reading about every ten minutes over LoRaWAN to the station, which carries them online. The dashboard is free. You can read more on our weather data page.
So who should not buy one? A farm that already sits within local range of a well-maintained public station or a neighbour's station. A grower who only wants to know if it rained and is better off with a plain gauge and a notebook. Anyone who will not clean a funnel every week. For the bigger picture, our post on climate change and crop yields in Kenya looks at how rising temperatures and erratic rainfall are affecting maize, tea and coffee.
What a gap looks like
A gap means a row is missing. It is not a zero, and the first rule is never to treat it as one. When the station skips an interval, the dashboard shows a hole or a flat join between the neighbouring points. For those minutes, rain, wind and humidity are unknown.
Gaps have causes all along the path. The sensor can stop. The mast can lose power on a run of cloudy days. The SIM can lose signal or run out of data. Wi-Fi can drop. At network level, the AICCRA summary of the Automatic Weather Station Data Tool describes ADT. ADT is a free web application developed by Columbia University's International Research Institute for Climate and Society. It lets national meteorological services access, quality-control and visualise data from different networks in one place, and see which stations are working and which are offline.
AICCRA also points out that a country can end up with many networks. Each one is built by a different company, needs different parts and repair processes, and stores data in formats that cannot talk to each other. The ADT view for Kenya shows seven network types and flags duplicate coordinates. That is another kind of gap: two stations claim one point, so one location is wrong, and every distance calculated from it is suspect. Ask how a summary handles a partly empty hour. A rainfall total built from a record with holes is a minimum, not a total.
Stuck values, and the failure modes to check every week
A reading that sticks is worse than a missing one. It still looks like data. The sensor keeps sending a believable number, yet it no longer follows the air. The UF/IFAS guide makes the point clear: wrong data is worse than no data, and cleaning up data may cost more than keeping a station in good working condition. Upkeep is cheaper than repair after the fact.
Each sensor has its own signature, and each can be checked against the others:
- Rain stuck at zero through a day when humidity sat at 100 percent: suspect a clogged funnel, as the UF/IFAS guide describes, before you believe it stayed dry.
- Humidity pinned at the ceiling through a hot afternoon: above 90 percent a medium-cost sensor is already within plus or minus 4 to 5 percent, and a pinned value is beyond even that.
- Wind speed and gust both at zero, hour after hour, on an open site: a stalled anemometer, since a gust is the interval peak and cannot be zero if anything turned.
- Sunlight reading the same low value at midday, or a little lower each month: a dirty dome or a failing sensor, not a duller season.
- Temperature that never moves overnight or by day: check the shield and the cable before blaming the weather.
- Two stations at the same coordinates: a data-entry fault. Fix it before using any distance.
Each of these leaves the other sensors disagreeing with the stuck one. That's the test: read the row as a whole. A row that agrees physically cannot hide a dead sensor for long. A weekly check of the funnel, the dome and the anemometer is the cheapest quality control a station will ever get.