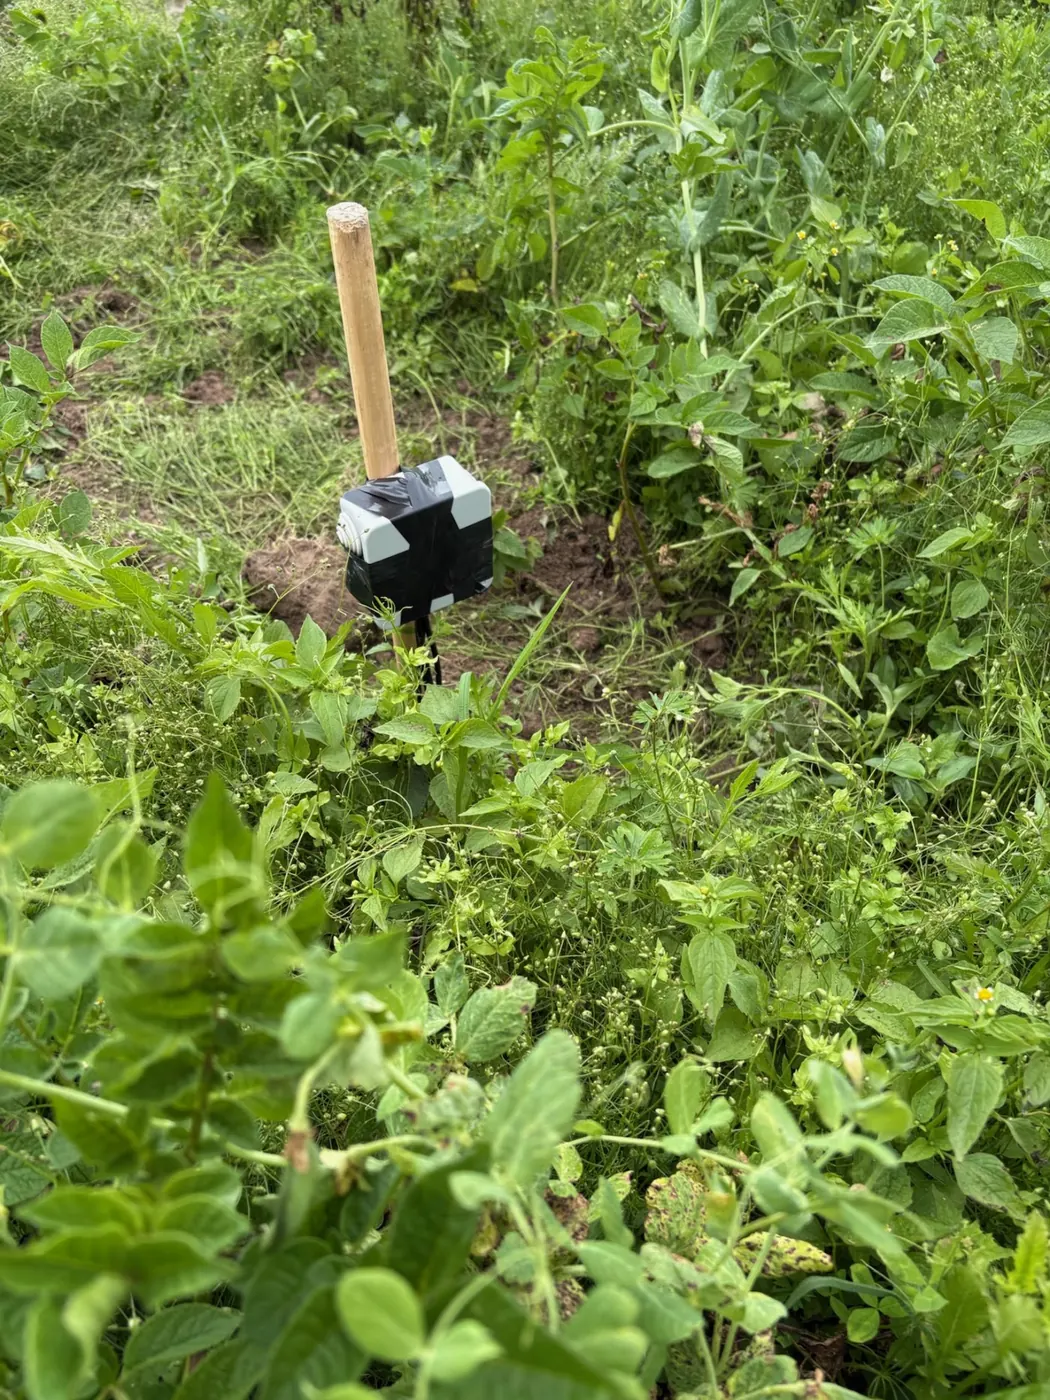
What the cups on the mast are actually counting
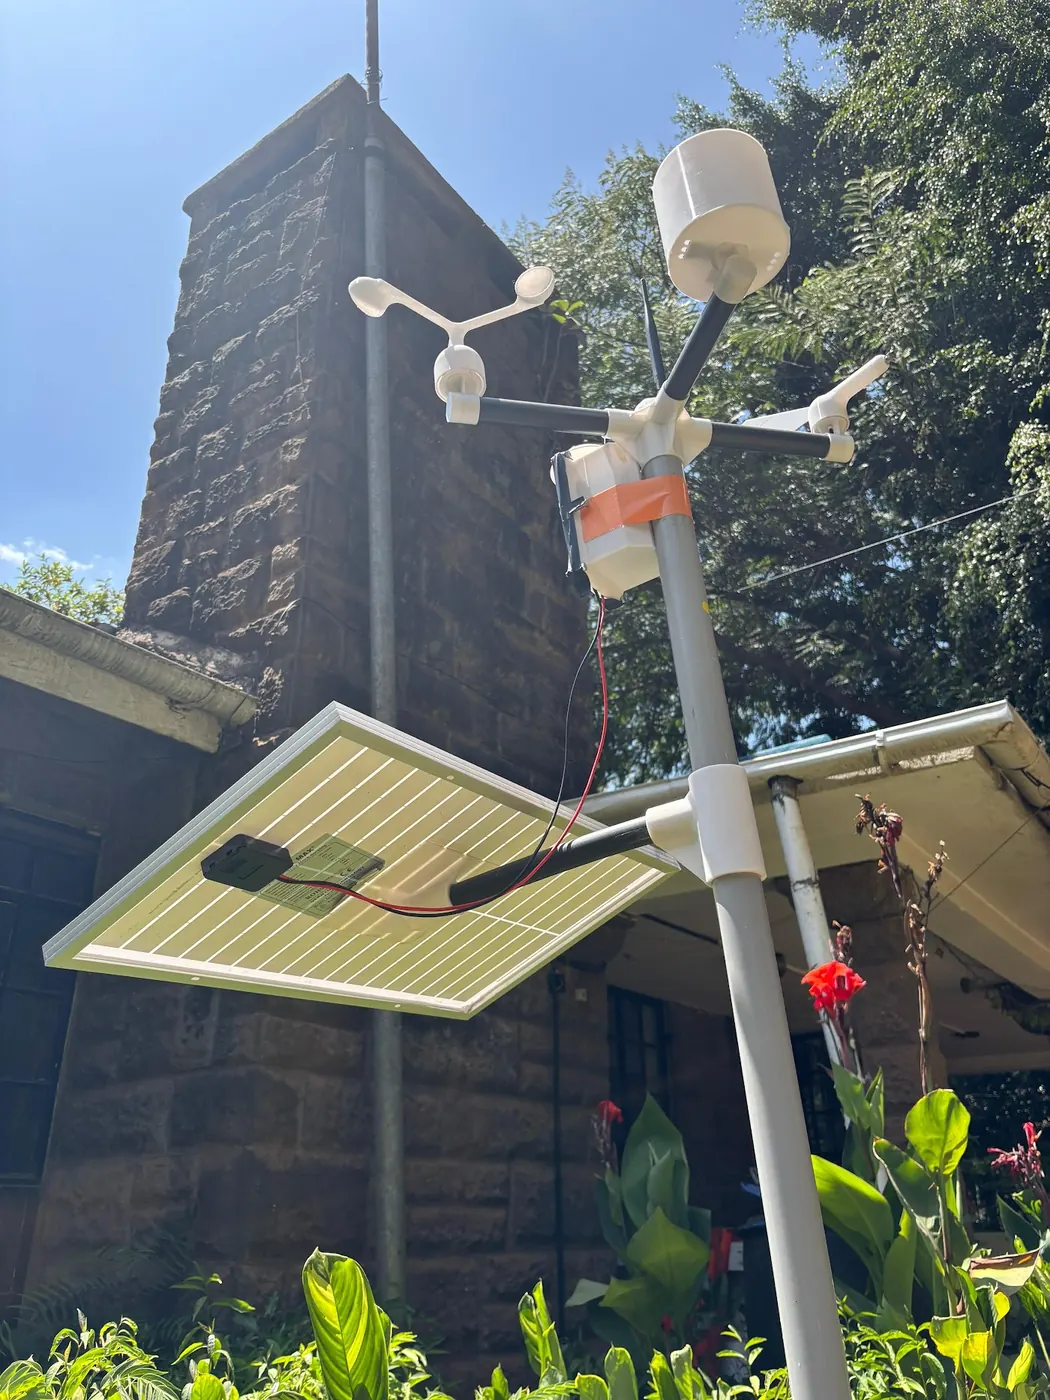
On a farm mast, a wind sensor is normally two instruments bolted to the same arm: an anemometer that turns and a vane that swings. The anemometer is the one that makes the number people argue about. The FAO annex on measuring and assessing the integrity of weather data calls the three-cup anemometer the most common wind-speed instrument on agricultural weather stations, notes that propeller types are common too, and adds the condition that matters on a dusty Kenyan block: both work reliably only when the mechanical parts are maintained. Air catches the cups, the shaft spins, and a magnet or an optical gate closes a circuit on every turn. Those closures are counted as pulses. Nothing in that chain measures speed directly. Speed is worked out later from how many pulses arrived in a known stretch of time. Our own stations follow exactly that chain: pulses are counted and converted to a speed, the gust is held as the peak inside the reporting interval, and direction is reported alongside. Every disagreement between a phone and a mast, between two neighbouring farms, or between Monday and Tuesday traces back to one of four things: how the turning was counted, how long it was averaged, how high the cups sat, and what the air had to pass over before it reached them. Counting comes first because growers assume it is trivial, yet it is the part that quietly degrades. A bearing that drags, a cup packed with dust, a web across the shaft: each one lowers the pulse count without raising an alarm. Hold that thought for the last section.
Pulses become a speed only when you choose a time window
A pulse count by itself tells you nothing. Forty turns could be a gale in one second or a breath over an hour. Someone has to divide that count by a duration, and the logger builder or the person who configured it makes that call, never the wind. Our stations use a window of roughly ten minutes, which is why the dashboard gives one wind figure for each ten-minute row instead of a needle that twitches. A longer window smooths more. A shorter one keeps more of the real variation and gives a higher top figure, because a brief strong puff gets diluted across ten minutes but survives in a one-minute average. When two instruments disagree, ask first what each one was averaging over, not which one is broken. If you want to compare your farm mast with figures from the Kenya Meteorological Department, find out what averaging period and what height their series uses before you set the two numbers side by side. A station run to international exposure conventions and a farm logger set to a ten-minute mean are answering slightly different questions about the same air. Neither is wrong. For a grower on a phone the result is simple: the speed on the screen is a mean over the window, and the window sits in the station's documentation, not on the screen. Find it once and write it on the inside of the gate.
The gust is a peak inside the interval, not a second wind
Growers often read the speed and the gust as two things the air did, a steady wind and then a stronger one. They are two summaries of the same pulse stream. Speed is the mean over the reporting interval. Gust is the highest short-period value found inside that same interval. On our hardware that is exactly what it is, a peak over the interval rather than an instantaneous spike, and the difference matters whenever you compare a gust with a threshold. A gust is also an averaging convention of its own, a point most wind articles skip. A wind-tunnel study of anemometer response catalogued by Agris found that gust and peak factors, and the turbulence intensities an anemometer reports, vary with the averaging duration used for the gust and with the turbulence and speed of the incoming air. Shorten the gust duration and the gust rises in the same wind. Lengthen it and the gust sinks toward the mean. Nothing about the air changed. Only the clock did. The same study warns that a change of anemometer or of gust duration creates breakpoints and shifts in a wind time series, so long records need homogenising before anyone reads trends from them. On a farm that warning is ordinary and real. Replace a station, or let a firmware update change how the peak is held, and your gust history before and after becomes two different series stitched together. A month that looks windier may be nothing but a shorter gust window. Write the change down with the date. That also explains why the same wind gives two gust figures on two devices held side by side. A handheld meter that updates every second holds a one-second peak. A logger that reports a ten-minute row may hold a peak over a few seconds, or over a longer slice, depending on its firmware, and the handheld will nearly always read higher in gusty air because its slice is shorter. Neither device is lying. So do not ask whether the gust figure is accurate. Ask what duration it summarises, and keep comparing like with like. A gust from a phone app, a gust from a neighbour's handheld and a gust from the mast are three conventions, and only one of them is yours. For a threshold decision, use the convention your own record was built on, and if the threshold came from somewhere else, find out which gust duration it assumed before you borrow it.
Direction: a horizontal angle, set to true north
A vane is simpler than an anemometer and misread almost as often. A three-dimensional wind detection paper in Frontiers in Plant Science puts the limit plainly: a wind vane measures an angle from 0 to 360 degrees in a horizontal plane, and it is not suitable for a vertical layout. It tells you which way the air is coming from across the ground. It says nothing about air rising off a hot bare field or sinking down a cold slope at night, and on a Kenyan block beside an escarpment that vertical component is real even though no vane will ever show it. Two installation details decide whether the horizontal angle is even usable. The first is the reference. Road-weather siting guidelines from the US Federal Highway Administration specify that the direction sensor should be set on true north rather than magnetic north. A vane lined up by eye with a phone compass is aligned to magnetic north, and the offset between the two is a fixed error baked into every direction reading until someone corrects it. The second is co-location. Arizona extension guidance, cited in the next section, says the anemometer and vane should be mounted together. That sounds obvious until you see a vane on the house and cups on the water tank. Air arriving at two points separated by a building is not the same air. Direction has one job on a farm: it says which side is upwind of a given sensor, a crop or a neighbour. That is enough for drift questions and for working out which obstruction is contaminating the speed reading.
Mast height: five published numbers, five different jobs
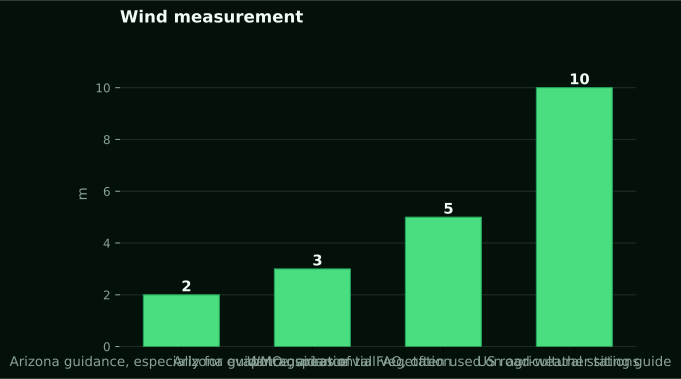
There is no single correct height for a wind sensor. Anyone who gives you one without asking what the reading is for is guessing. Sources disagree because their purposes differ. Arizona guidance on choosing and siting weather equipment gives 2 m as the height, especially where the station is used for evapotranspiration, and 3 m as better for areas of tall vegetation. FAO's annex, citing WMO guidance, places agricultural anemometers at not less than 2 m and often at 5 m. Road-weather sensors sit at 10 m above ground in the Federal Highway Administration guide. A World Bank site installation report records one station whose wind sensors were set at a total height of 8 m above a roof top. Five heights, each defensible for its own job. You cannot swap them, because wind near the ground is slowed by everything it rubs against, so the same air gives a lower reading on a lower mast. A 2 m figure and a 10 m figure from the same farm on the same morning are both correct and are not the same number. Why 2 m for water work? Because the reference evapotranspiration equation was built around a wind measured at that height, and feeding it a reading from a taller mast pushes the water figure up for no physical reason. Why taller elsewhere? To lift the sensor clear of canopies and buildings so the reading stands for the wider airflow rather than the eddies around a maize field. That is why the roof-top installation went to 8 m: a roof is itself an obstruction, and the sensor had to climb above the disturbed air it creates. On a Kenyan farm the question comes before the mast does. If the reading feeds a water budget, follow the 2 m convention. If the block carries tall crops, or you want one figure that stands for the whole farm, go higher and record the height. Where a grower has already fixed a mast at some other height for the rain gauge or the solar panel, the honest move is not to pretend the wind is at 2 m but to write down the real height so anyone using the record later knows what they are looking at. Whatever you choose, never compare it to a figure from a different height without saying so. Height is written on the mast once and copied into every comparison forever.
Fetch, obstructions and the ten-times rule
Height is the setting people fuss over. Fetch decides whether the number means anything. FAO's annex puts it bluntly: accuracy of a wind-speed measurement depends on the upwind fetch as much as on the instrument, and a large upwind stretch free of buildings and trees is required for a representative reading. Federal Highway Administration guidance turns that into a rule a grower can pace out. Put the wind sensor at a distance of ten times the height of the nearest large obstruction. Its own worked example: an obstruction 20 feet, or 6.1 m, tall means the sensor should stand 200 feet, or 61 m, away. A grain store, a line of grevillea, a two-storey farmhouse: measure the tallest one, multiply by ten, and that is how far the mast needs to be from it on the side the wind usually comes from. Steep slopes within about 90 m should also be avoided where possible, the same guide says, because a bank or a cutting bends the airflow before it reaches the cups. Those figures were written for towers beside highways, which is why the guide also talks about distance from the paved edge, a detail that means nothing on a farm. The obstruction rule still transfers cleanly because it is physics, not policy. Kenyan smallholdings make it hard to honour. Ten times a windbreak's height may be most of the plot. That is a real constraint, and the honest response is to pick the least bad position and write down what stands upwind of it, rather than pretend the reading is clean. Our post on how much clear ground each sensor needs works through the same arithmetic for the other instruments on the mast, and the wind sensor is the one that pays most dearly for a compromise.
Valleys, ridges and the Rift: where the textbook profile stops working
Everything above assumes flat ground. A good deal of Kenyan farming does not happen on flat ground. A field evaluation of temperature and wind-speed sensors in mountain conditions makes the point for terrain generally: in mountains, wind profiles differ substantially from those over flat terrain, and valley and canyon winds cannot be described reliably by conventional assumptions. Those assumptions are what let you relate a reading at one height to the wind at another, or compare a farm mast with a distant station. On a slope above a Rift Valley floor, or in a fold of the Aberdare foothills, air drains downhill at night and climbs by day, and the direction that matters at breakfast may reverse by mid-afternoon without any change in the weather map. No figure in the sources quantifies that for any Kenyan site, and this article will not invent one. What the evidence does support is a change in how you read your own data. In broken terrain a mast stands for the slope it is on, and a neighbour across the valley with the same instrument at the same height is measuring a different wind. Turbulence adds a second layer. In the Agris tunnel work, high turbulence broadly replicated urban terrain and low turbulence approximated exposed open country, and the gust and peak factors measured depended on that turbulence. A mast among farm buildings is in the rough category even on level ground. Expect higher gusts relative to the mean there, and do not read that ratio as a property of your region. It is a property of your yard.
Why the phone and the mast give different wind numbers
Put the steps together, and the disagreement between a weather app and a farm mast stops looking like a fault. An app shows a value from a model for a grid cell far larger than a farm, at whatever height and averaging that model uses. A mast shows a count of pulses over a stated interval at a stated height behind whatever stands upwind of it. Related, yes. Interchangeable, no. This blog made the same argument about rain in why a phone rainfall figure and a field gauge disagree, where the gap came down to a grid cell against a funnel. For wind the gap is wider, because the quantity itself changes with height and averaging in a way rainfall does not. Our own wind sensors report speed, gust and direction roughly every ten minutes, as past readings over a stated period. They do not forecast, and nothing on this site should be read as an outlook. What the on-farm figure offers is that it is yours: your height, your fetch, your averaging, applied to the air actually crossing the block. What the app offers is that it exists before the morning does. Asking either one the other's question is the failure, and the fix costs nothing except the habit of saying, every time a wind figure is quoted, where it came from and over what period.
Drift, drying and structures each want a different wind figure
Drift means anything airborne, dust, spray or pollen, moving away from where it was released. The wind that controls it is the wind in the layer where that material travels. This is where a standard farm sensor is weakest, and the Frontiers paper says so plainly. Cup anemometers, it notes, are usually used for outdoor agricultural meteorology. They are not used for the air-assisted flow around a sprayer, where the wind field is three-dimensional. To measure such fields conventionally, you lay separate sensors along each axis. Those sensors take up space, interfere with each other, and change the flow they are supposed to measure. The ultrasonic and MEMS instruments in that review give two-dimensional results. Even the paper's purpose-built three-dimensional sensor had a minimum relative speed error of about 0.06 percent, a maximum of about 10 percent and an average under 5 percent across directions. That shows how much work a proper wind field takes. It also shows how far a single cup anemometer on a mast is from one. So the mast gives the horizontal wind at mast height, averaged over the interval. That is a reasonable proxy for whether conditions are drifty in general. It is not a measurement of the air at the nozzle. Our spray window quality score is built on exactly that proxy. From 25 September to 25 October 2026, across 6038 station-hours from 12 stations, 21 percent of hours scored 60 or better on the 0 to 100 index. 55 percent scored below 30. What to spray and how belongs in the NuaSense guide on how to apply pesticides safely in Kenya. That guide covers choosing a product and identifying the pest before timing an application. Drying asks a different question. Evaporative demand takes a wind at 2 m, which is why Arizona singles out that height. Our stations compute hourly reference ET0 with FAO-56 from their own readings: 1.7 mm per day averaged across 12 stations over the same period. That is a reference figure for well-watered grass, not any crop's water use. Feed a wind from a taller mast into that equation and the water number inflates silently. FAO's annex lays out the stakes. The rule that no data are better than bad data applies to weather data. Biased, faulty or nonrepresentative local data can lead to worse irrigation decisions than a reasonable estimate would. That is uncomfortable for anyone selling sensors, and it is correct. Structures ask a third question. Greenhouse film, shade net, a tank stand and the mast itself care about peak load, which comes from the gust, not the mean. The gust duration therefore decides what design wind your record hands an engineer. No structural load figure appears in the sources and none appears here. What does transfer is the Federal Highway Administration advice. A tower pad should account for soil conditions, frost and wind loading. The tower and sensor exposure should be documented in a metadata file. Frost is rarely the Kenyan concern. Black cotton soil that swells and shrinks with the rains is, and a mast that leans changes both the height and the angle of the cups. Write down mast height, gust duration if the documentation gives it, installation date, what stands upwind and how tall it is, and every change to any of those. Without that page, a year of gust readings is unusable for anything structural.
Failure modes: when a low number is a sick sensor, not calm air
A cup anemometer fails by reading low, and it fails gradually. That mountain field evaluation documents the mechanism with ice, but the physics is the same for anything that clings to the cups. It reports clear underestimation during ice accretion. The error grows nonlinearly with ice thickness to about 20 percent before freezing-induced failure stops the instrument. It also notes that ice or dirt accumulation inside the cups already causes appreciable underestimation, depending on how much there is and where it sits. Morphology mattered more than thickness. Dry-growth ice degraded performance far more than wet-growth ice. Heating was no cure, since heated and unheated cups both lost performance. The authors list contamination, air-density variation, aerodynamic disturbance, bearing drift and surface changes as routes to progressive deterioration. Ice is a highland rarity here. Red dust, wasp nests and a bearing that has drunk a season of grit are not, and they walk the same path. The reading sinks, slowly, while the sky looks the same. A sudden run of calm on the dashboard should send someone up the mast before it sends anyone to a conclusion. Alternatives carry their own limits. A portable ultrasonic sensor study in Scientific Reports achieved average airflow errors within plus or minus 0.1 metres per second. But it did so in mine roadways, where it also noted that contact sensors suffer from dust, humidity, vibration and manual reading error. That is the case for ultrasonic underground, not proof it suits a farm. The same paper's point that sensor layout changes the measured average speed across a cross-section is a reminder that where you put the instrument is part of the instrument. Calibration is not a cure either. Agris tunnel work ran at low turbulence of about 1 to 1.5 percent against a 3D reference under ASTM D5096-02, conditions no farmyard offers. A City, University of London calibration study found a physics-based calibration losing accuracy at low speeds and high turbulence. Its physics-guided neural network cut the error in wind-speed standard deviation from 92.3 percent to 9.8 percent. Real air is messier than the tunnel, and a sensor that passed its calibration can still misread in a gusty yard. A grower's version is cheaper. Spin the cups by hand and listen for drag. Confirm the mast still stands where the metadata says, at the height it says, pointing at true north. Walk the upwind side and check nothing has been built or planted inside the ten-times distance since the last check. If nothing on the farm turns on a wind figure, buy nothing. If a spot check before a job is all you need, a handheld is enough. A station at KES 30,000 excluding taxes includes the wind sensor. It earns that only if the ground around it has been dealt with first, because a well-sited cheap instrument beats a badly sited good one every day of the season.