A farm manager in Meru wants to know whether last week's storm reached 40mm on his own block. Or whether the number he saw was a county average that missed his ridge entirely. That gap, between what he wants and what is available, is the whole subject of this piece. Rainfall data Kenya sources fall into five rough categories: the national meteorological service, satellite-derived grids, phone apps, a neighbour's gauge, and a gauge you own. Each one answers a different question, at a different resolution, for a different price. None of them is wrong. Each is wrong for some use.
Measured by NuaSense weather stations and soil probes on Kenyan farms, over the period stated with each figure. Past readings, not a forecast.
The decision this actually turns on
Before comparing sources, name what you are deciding. A spray window decision needs today's rainfall, at your field, within hours. A planting date decision needs a season's worth of pattern at roughly your location, over years. A crop insurance claim, or a drought analysis, needs a long, consistent record that someone else has already quality-checked. Three needs, three different sources. A grower who reaches for the wrong one usually does not notice until the decision has already gone wrong.
The temptation is to find one number and trust it for everything. Checking three sources feels like overkill on a Tuesday morning. But a monthly satellite grid cell and a same-day tip count from a bucket gauge are not interchangeable, even when both are labelled rainfall in millimetres. The previous piece on this site, working out what one gauge tip is actually worth, makes the same point from the instrument side: a millimetre figure carries assumptions about mechanism and timing that most readers never see.
So the real first step is not choosing a source. It is deciding what decision you are making this week, and matching resolution and recency to that decision rather than to whatever is easiest to open on a phone.
The Kenya Meteorological Department, and what its Maprooms actually show
The Kenya Meteorological Department's Climate Data Management Services division manages climate data collected from its own observation network and from partner stations. It arrives by paper register, email and internet feed from automatic weather stations. That mixed intake matters. A figure that started life on a paper form, transcribed later, carries a different error profile than one that arrived automatically. CDMS also runs a data rescue effort, pulling old records off punchcards and magnetic tape. That tells you something about how patchy Kenya's historical record is beneath the surface polish of any modern dashboard.
The public-facing product is the KMD-ENACTS Maprooms, a climate information portal available around the clock. It merges station data with satellite estimates to produce dekadal (ten-day) and daily rainfall information. A user can pull a figure for a county, a ward, or a specific grid point. This is the closest thing Kenya has to an official rainfall data Kenya reference: free, countrywide, and built specifically to plug the gaps a sparse station network leaves behind.
The catch sits in that merging step. When a satellite estimate fills in for a missing station, the ward-level figure you see is partly modelled, not purely measured. The portal does not flag which parts of a given number came from which source on a given day. That is a reasonable design trade for national coverage. It is a real limitation if you are trying to reconcile a Maprooms figure against what your own gauge recorded that same day.
Satellite rainfall grids, and the resolution problem they never advertise
CHIRPS and comparable satellite-and-gauge blended products sit behind a lot of the rainfall figures used in food security and drought analysis. The World Bank's rainfall shock analysis uses monthly rainfall data from the Climate Hazards Group at 0.05 degree resolution. It builds drought and flood variables for food security work in Uganda. A 0.05 degree cell is roughly five kilometres on a side. That sounds precise, until you remember that a single cell can straddle a ridge, a valley and two different soil types on a real farm.
That resolution is fine for the question the World Bank analysis was built to answer: whether a region experienced a rainfall shock over a month, for the purpose of understanding food insecurity at scale. It is the wrong tool for deciding whether to spray a specific greenhouse block tomorrow. The monthly time step alone rules that out. A five-day dry spell inside an otherwise wet month simply disappears into the average.
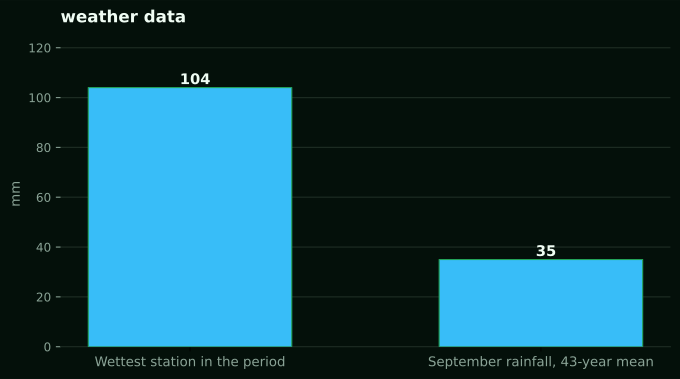
Our own station network gives a concrete sense of how much a single grid cell can hide. Over the same 21 August to 20 September period, station totals recorded across four NuaSense weather stations ranged from 0.4mm to 104.4mm. Those stations are not co-located. This is a measured spread between separate sites, not a claim about any one region's rainfall. But it shows why a satellite grid cell averaged over roughly 25 square kilometres will smooth away exactly the kind of local variation that decides whether one block needed irrigation and the one next to it did not.
Phone apps: convenient, and built on the same grids underneath
Weather apps on a smartphone are the source most growers reach for first. They are already installed and already free. Almost none of them run their own observation network in Kenya. What they show for a rural location is typically an interpolation from the same sparse station network and satellite products discussed above, sometimes blended with a global forecast model. The app adds a friendly interface. It does not add ground truth.
This is not a reason to distrust an app outright. It is a reason to ask what a specific app's rainfall figure for your area is built from, and how far the nearest real observation sits from your farm. An app showing rain for your named town is not showing rain measured in your town, unless you can establish that a station sits there. For most of rural Kenya, no station does.
The practical test is simple. Compare what the app said for yesterday against what you can see happened on your own ground, over a few weeks. If the two track reasonably well, the app is drawing on data close enough to be useful for rough planning. If they diverge often, treat the app as background context, not a number you act on.
A neighbour's gauge, and why distance matters more than most growers assume
A rain gauge on a neighbouring farm, or one kept by an extension office nearby, feels like the obvious fix for the resolution problem. A real bucket, real tips, no satellite guesswork. It is an improvement over a grid cell, but it inherits its own limit. That limit is distance, not accuracy.
Related reading on this site: rain gauges, Rainfall data accuracy: why your phone and your field gauge disagree.
Kenya's terrain does a lot of the damage here. The research on East African rainfall variability documented in the PMC review of enhanced rainfall variability in Kenya describes how complex topography shapes rainfall through orographic lift, low-level jets and lee rain shadows, meaning storms can behave very differently across short distances where hills, ridges or lake effects intervene. A neighbour's gauge two ridges away is not necessarily reading the same storm you got, even if the map makes the distance look trivial.
The same review also notes something that undercuts a common shortcut. Seasonal and intraseasonal rainfall variability in Kenya increased significantly after 2013, and that increase came with diminished coherence between the El Niño Southern Oscillation and local rainfall. Growers who used to lean on a good rain year at a nearby station, or on an ENSO-based seasonal outlook, to infer their own conditions are working with a relationship that has weakened. A neighbour's record from ten years ago is a starting point, not a rule.
Your own gauge, what it buys and what it still cannot tell you
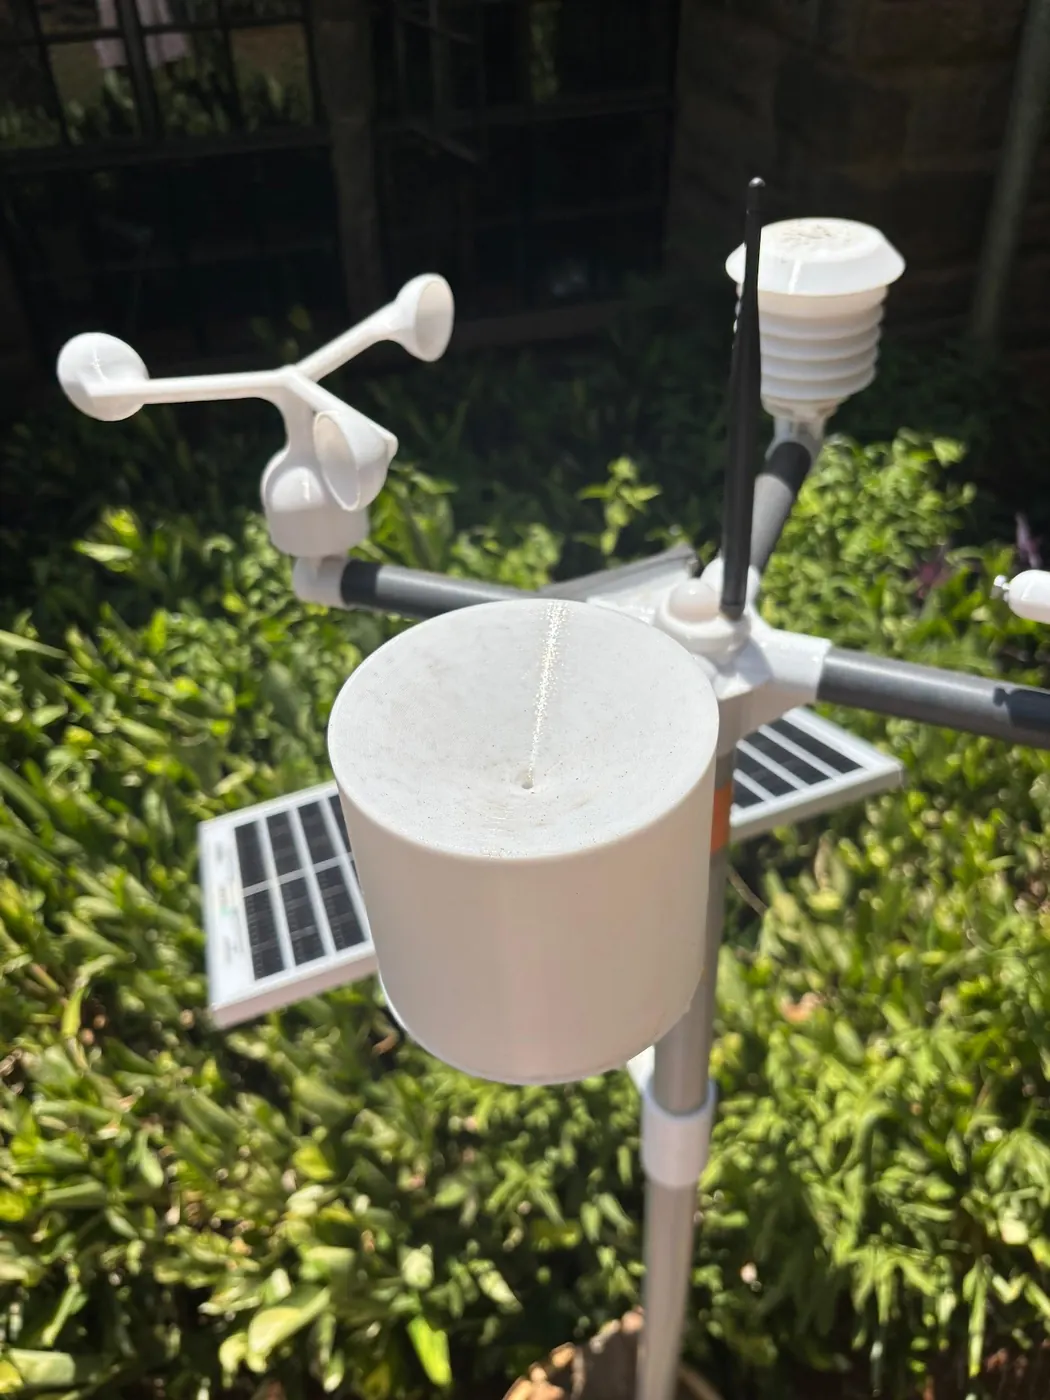
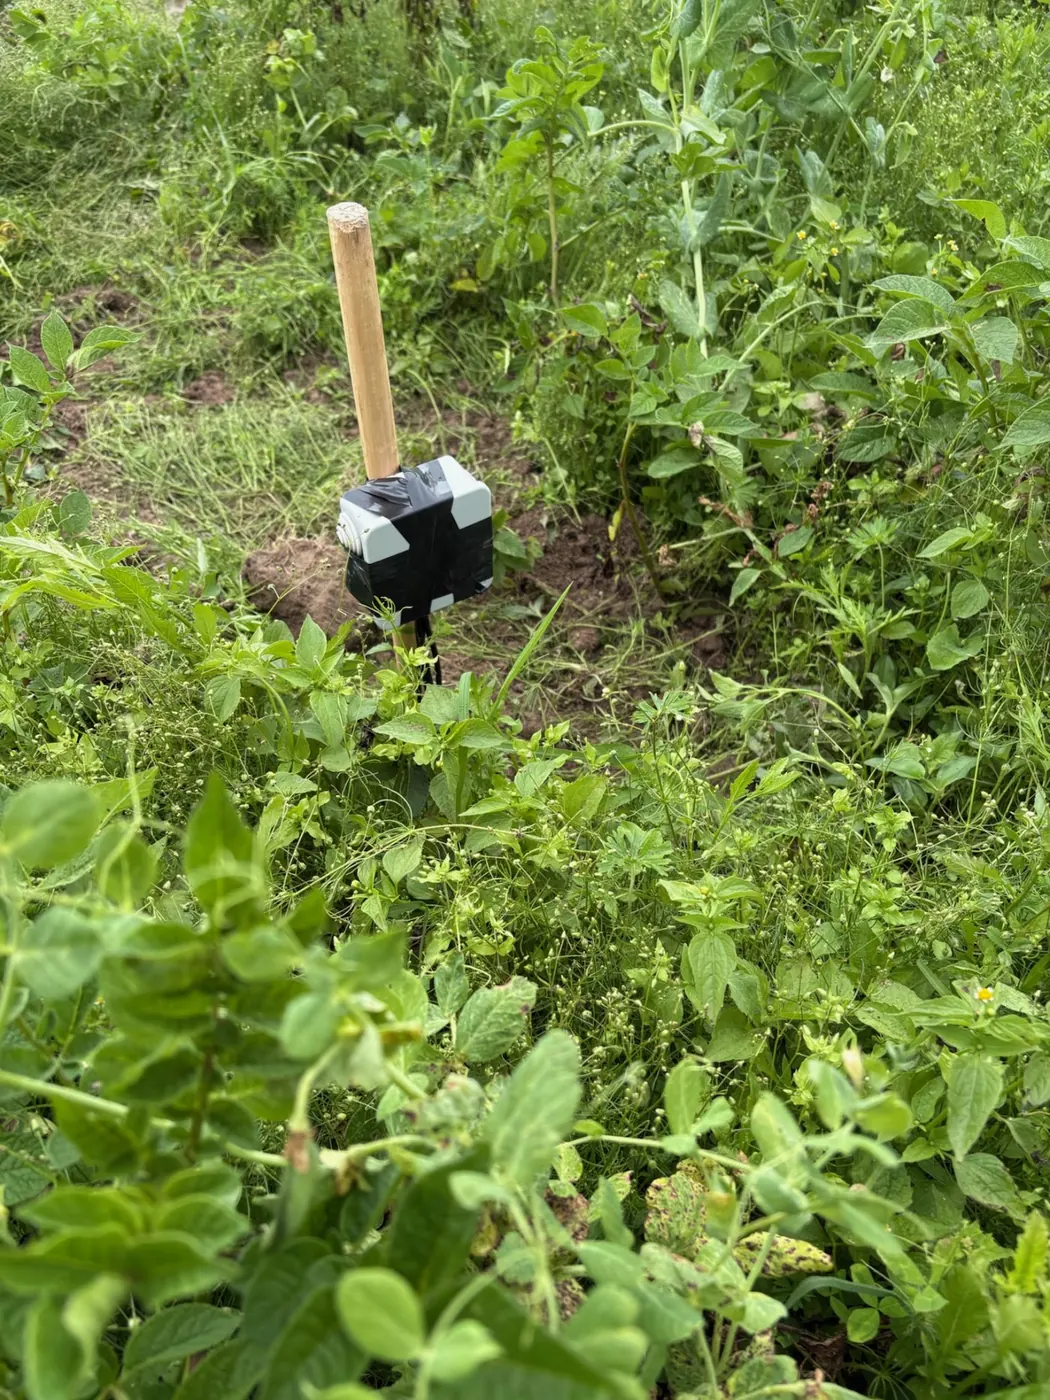
A gauge on your own field removes the distance problem entirely. It measures what fell where the crop is standing, at the time it fell, and nothing about topography or a satellite pixel boundary changes that. This is the only source in this list that answers the spray-window question directly. It is the only one reading your actual ground in near real time.
A tipping-bucket gauge, the mechanism most automated stations use, counts tips and converts them to millimetres using a per-tip volume the gauge is calibrated to. That calibration is a per-installation value, not a fixed spec. Worth knowing if you are comparing two different gauge models rather than assuming all tipping buckets read identically. Understand the mechanism, not just the number it produces, before you trust a reading during a heavy burst. Intensity affects how cleanly the bucket keeps up.
What a single gauge still cannot do is tell you about the block down the road, or give you a multi-decade baseline the way a national record can. Our own station network's rainfall channel is one part of a broader package, alongside air temperature, humidity, wind and a computed reference evapotranspiration figure. Together they answer the day-to-day operating questions a national dataset was never built to answer. Across the network, only 1.8 percent of ten-minute readings recorded any rain at all over the 21 August to 20 September period. That is a useful reminder that most of the value of continuous measurement is in catching the rare wet interval precisely, not in averaging a mostly dry record.
What a long record actually adds that a live gauge cannot
None of the above solves the problem of knowing what normal looks like for your location. A live gauge, whether yours or a neighbour's, tells you what happened this week. It says nothing about whether this week is unusual unless you can compare it against a long record for the same spot.
This is where the CHIRPS-type satellite record earns its keep despite the resolution limits already discussed. At the grid cells where our own stations stand, the long-term CHIRPS record shows September rainfall averaging 35mm across 43 years (1983 to 2025). It ranges from a driest September of 5mm in 1997 to a wettest of 79mm in 2020. That range, built from decades of consistent measurement, is not something any single season's gauge reading can give you, no matter how accurate that gauge is. It answers a different question: not what fell this week, but how unusual this week's total actually is against a long baseline.
Local academic studies fill a related gap for growers who want context specific to their zone rather than a national grid. A study of rainfall characteristics in the Central Highlands of Kenya published by Embu University found water insufficiency from scarcity, poor distribution and high variability of rainfall in that zone, alongside a decline in soil fertility. A single rainfall total would never surface that combination on its own. A separate study assessing smallholder perceptions of changing rainfall patterns around Mt. Kenya west set out to establish how farmers' lived sense of rainfall change over fifteen years compares with what the record actually shows. That is exactly the kind of ground-truthing a satellite grid alone cannot provide.
Comparing the five sources side by side
Laid out together, the trade-off between coverage, resolution, cost and immediacy becomes easier to weigh than any single description can manage.
- KMD Maprooms: free, covers county, ward and grid points, dekadal and daily data, merges station and satellite input so some figures are partly modelled rather than purely observed.
- Satellite grids (CHIRPS-type, as used in the World Bank's food security work): free where published openly, roughly five-kilometre cells, typically monthly resolution, strong for long-run baselines and drought analysis, poor for a same-day irrigation or spray decision.
- Phone weather apps: free, convenient, generally interpolating the same sparse station network and satellite products underneath a friendly interface, accuracy for a specific farm untested unless you check it yourself.
- A neighbour's or extension gauge: real ground measurement, but reliability drops with distance and with the terrain between the two sites, given how much topography shapes East African rainfall at short range.
- Your own gauge, for example a NuaSense weather station at KES 30,000 excluding tax: reads your exact ground in near real time, priced as a one-off hardware cost plus a data fee typically about one US dollar a month over Safaricom (free on Wi-Fi), but gives you no long historical baseline on its own.
Where a national record can mislead a local decision
The most honest thing to say about Kenya's rainfall data landscape is this: the increase in variability documented after 2013 makes every historical baseline a little less reliable for forward planning than it used to be. The Nature Scientific Reports paper on enhanced rainfall variability in East Africa links the recent decline in the March-April-May long rains partly to decadal variability in the Pacific Ocean, specifically the negative phase of the Pacific Decadal Oscillation. That driver operates on a timescale a single farmer's planning horizon cannot really track. That does not make the historical record useless. It means a forty-year average is a description of the past, not a promise about next season.
A study of rainfall variability, drought occurrence and interpolation techniques in eastern Kenya from Kenyatta University examined exactly this: how well different methods of filling gaps between sparse stations actually perform in a region with real seasonal variability. The finding that matters for a grower is less the specific interpolation method than the underlying admission. Eastern Kenya's rainfall record has enough gaps that any single number for a given location already carries some estimation baked in, however official the source.
None of these sources forecasts what rain is coming. Every figure discussed here, from the Maprooms dekadal totals to a CHIRPS grid cell average to a station's own tip count, describes what has already happened, over a stated past period. That is a real limit on how they can be used. None of them tells a grower what next week holds, only what last week, last month or the last four decades looked like at a given point on the map.
What actually changes the decision on the ground
Put the pieces together and a workable approach looks less like picking one winner and more like assigning each source its actual job. Use the KMD Maprooms or a CHIRPS-type grid for the long view. Is this month wetter or drier than the four-decade average for this location? Use a nearby gauge, whether a neighbour's or your own, for what actually fell on the ground this week. Distance and terrain both erode how well a neighbour's number stands in for your field. And treat a phone app as a rough cross-check rather than a primary source. It very likely draws on the same underlying grids without adding new ground truth.
For a farm manager weighing a spray decision or an irrigation schedule day to day, a gauge on the actual block earns its keep quickly. Particularly once it is reporting alongside temperature, humidity and computed reference evapotranspiration rather than rainfall in isolation. The NuaSense sensor and alert system puts field sensors and that computed layer together. So a rainfall reading sits next to the other numbers that decide whether a spray window is actually open. That is a different job from the one the KMD or a satellite grid is built to do, and the honest answer is that a serious grower ends up using more than one of these sources, not settling on a single favourite.
The gap is worth naming plainly. No single Kenyan table tells a grower in a given ward exactly how much to trust each source for their specific plot. Building that judgement means comparing your own gauge against the nearest Maprooms grid point for a season or two. Note where and how often they disagree. That comparison, done once, is worth more than any general rule this article or any other can hand you.