Search '0.2mm rain' and you mostly find weather forecasts, not explanations. The Kenya Meteorological Department publishes forecast ranges with a floor of 0.2mm, and the World Meteorological Organization's definition of a rainy day, used in a Kenyan drought and rainfall variability study, sets the same figure as the line between a dry day and a wet one. That is what 0.2mm actually is in Kenyan records: a threshold, not a bucket size. No source in front of us shows a rain gauge tip that measures exactly 0.2mm. The real tip volumes are close but different, and the difference matters more than it looks.
Measured by NuaSense weather stations and soil probes on Kenyan farms, over the period stated with each figure. Past readings, not a forecast.
What one tip is worth in litres per hectare
Take a tip that represents 0.25mm of rain, the value reported for the Rainwise 8-inch collector in Cornell's NEWA accuracy review of rain gauge measurements. A depth of 0.25mm over one square metre is 0.25 litres. A hectare is 10,000 square metres, so 0.25mm over a hectare is 0.25 x 10,000 = 2,500 litres. That is one tip. A single click of the reed switch, on this instrument, stands for two and a half tonnes of water landing on a hectare of ground. It sounds like a rounding error until you write it out in litres, and then it does not.
Now do the same for the Athens experimental gauges described in the Springer paper on low-cost rain gauge development. The 28cm-diameter gauge, RG28, tips at 0.221mm, which is 2,210 litres per hectare. The 20cm gauge, RG20, tips at 0.367mm, or 3,670 litres per hectare, nearly 70 percent more water per tip than RG28 despite being a smaller collector. The paper attributes the difference to the collector's cross-sectional area and the bucket's own volume, not to anything about the rain itself. Two gauges standing side by side in the same storm will report a different total simply because their buckets are built differently.
Why the '0.2mm tip' framing does not hold up
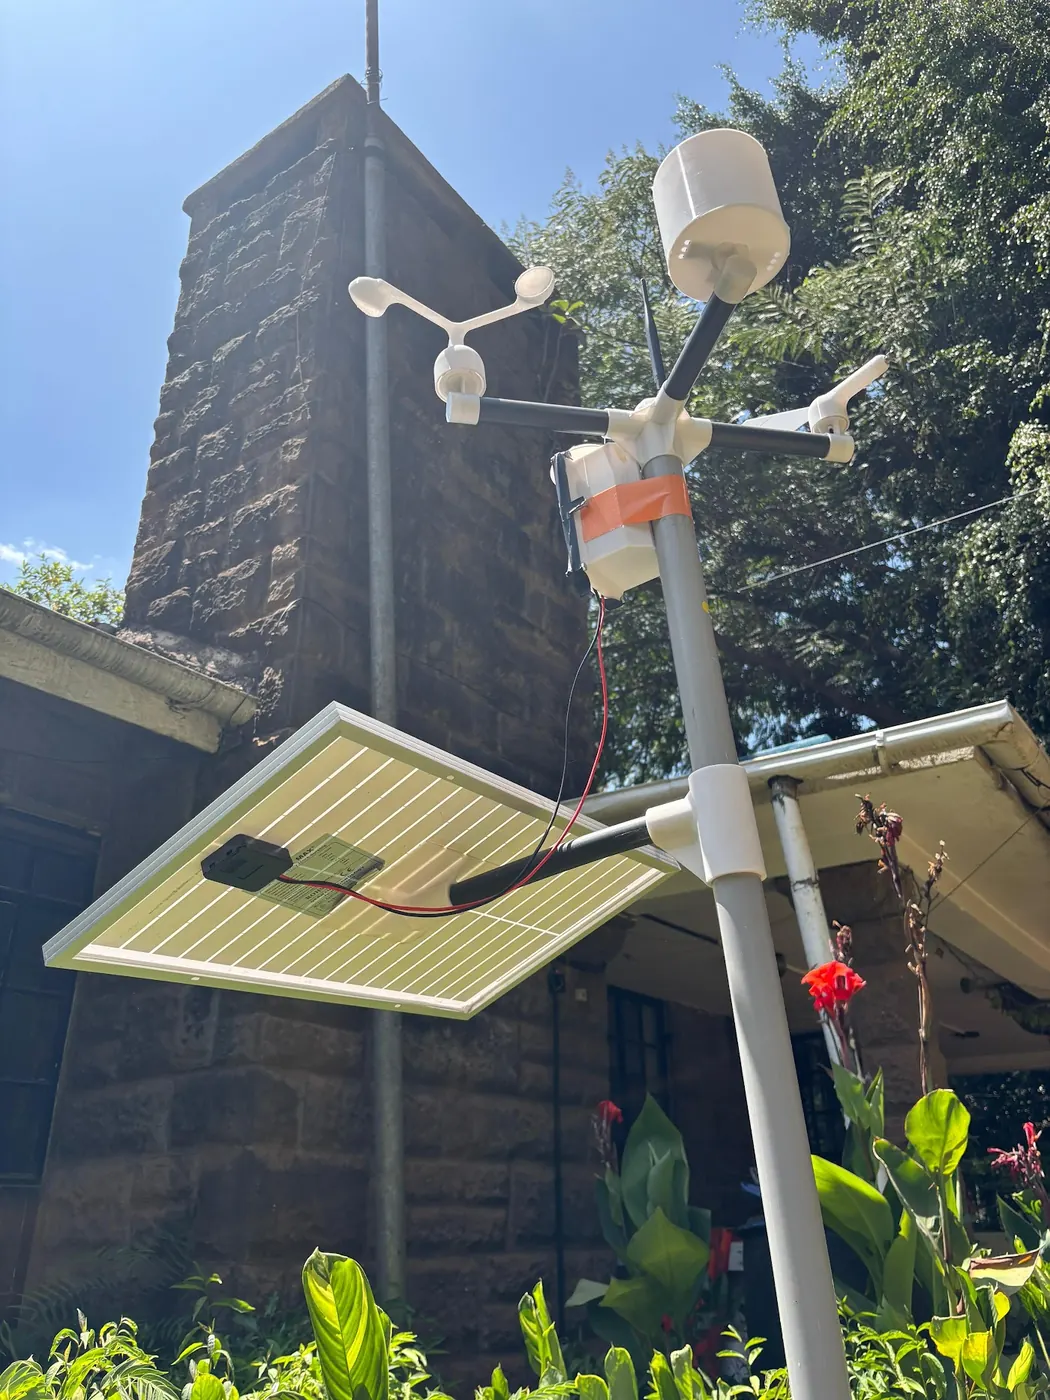
None of the tip volumes above land on 0.2mm. That number belongs to the threshold documents, the Kenya Met forecast range and the WMO rainy-day rule, not to any bucket geometry in the sources here. NuaSense's own weather stations use a tipping-bucket mechanism too, and the per-tip volume is a calibration value set per installation rather than a fixed spec we publish, precisely because gauge geometry varies. If you are trying to reconcile a '0.2mm resolution' claim on a spec sheet against a 0.25mm or 0.221mm figure from a manufacturer's own testing, the honest answer is that the round number in marketing copy and the measured tip volume in a lab test are two different things, and only one of them was actually calibrated.
The seesaw inside the collector
The mechanism itself is simple, which is why it has survived since Sir Christopher Wren built the earliest recording rain gauge, noted in the PMC review of tipping bucket rain gauges in hydrological research. Water funnels from the collector into one side of a small seesaw, two chambers balanced on a pivot. When one chamber fills to its calibrated volume, gravity tips it, dumping the water and swinging the empty chamber into place under the funnel. A magnet on the arm passes a reed switch on each tip, and that closing switch is the entire measurement. The RG28 gauge in the Springer paper used two ABS plastic buckets on a balance arm 15cm long, with each bucket 4cm high and 2cm wide. There is no clock inside, no volume sensor, nothing but a mechanical count of how many times gravity won.
That simplicity is exactly why the PMC review calls tipping buckets one of the most widely used pieces of rainfall equipment worldwide: low cost, low power, no moving parts beyond the seesaw itself. It is also why the same review calls measurement bias, mainly wind and mechanical underestimation, the main disadvantage of the design. A count of switch closures is only as good as the assumption that every drop of rain reaches the switch in time, and that assumption breaks in specific, predictable ways.
Where the moment of tipping loses water
During the swing itself, water is in mid-fall between chambers, and some of it does not land cleanly in the receiving side. The Springer paper is direct about this: rain water is lost during the tipping movement, and the resulting mechanical error grows with rainfall intensity, not with total rainfall. A drizzle that arrives slowly gives the mechanism time to settle between tips. A downpour keeps water arriving while the arm is still swinging, and some of that water spills past the switch uncounted. The instrument does not fail outright, it just quietly undercounts, and the faster the rain, the larger the gap between what fell and what got tipped.
The intensity ceiling
Duchon and Biddle's comparison, cited in the Springer paper, found tipping bucket gauges noticeably underestimated storm totals against a weighing-bucket reference once one-minute rain rates exceeded 50mm/h. The NEWA review describes the same failure from the equipment side: the tipping arm cannot keep up once more than 1.5 inches (about 38mm) falls in an hour, because water arrives faster than the mechanism can empty. During cyclone Daniel in Athens in September 2023, rainfall intensities reached 15mm in ten minutes, which works out to 90mm/h, well past that ceiling. Variations between the reference ARG100 gauge and the two test gauges were under 6 percent for RG28 and around 10 percent for RG20 during the highest-intensity intervals of that storm. That is a real, measured gap between instruments in the same rainfall, not a hypothetical.
What that gap means in practice is worth spelling out, because 6 to 10 percent sounds small until it is attached to the reading a grower is actually staring at. If a storm delivers 40mm and the gauge undercounts by 10 percent at its peak intensity, the recorded total is short by roughly 4mm, and that shortfall is concentrated in the fastest few minutes of the storm rather than spread evenly across it. None of the sources here measured a Kenyan storm at this resolution, so there is no basis for claiming Kenya's short or long rains behave like the Athens event. What does transfer, cleanly, is the mechanism itself: a tipping bucket anywhere degrades in this direction, worse as the rain gets heavier, never the reverse. If your farm's heaviest storm of the season also produced your lowest-confidence rainfall total, that is not a coincidence, it is the instrument behaving as documented.
Wind takes water before it reaches the funnel
The Springer paper gives a specific threshold for a second failure mode: observable wind-induced undercatch at ground-level gauges begins once wind speed at 2 metres exceeds 5 m/s, a little under 18 km/h. Wind does not damage the tipping mechanism, it interferes earlier, deflecting rain around the collector funnel before it ever reaches the bucket. A gauge mounted on an exposed ridge, in an open field with no windbreak, or on top of a water tank stand catches less rain than the same gauge in a sheltered spot in the same storm, and the gap grows with wind speed. NuaSense's own weather stations report wind speed as a rotating anemometer count converted to a speed reading, alongside gusts recorded as the peak within each roughly ten-minute reporting interval, so a farm with a windy station can at least check whether wind was in play on a suspect day, even without a published error figure to attach to the rain reading itself.
The previous piece on rain gauge undercatch and spacing goes further into siting choices that reduce wind exposure. The point worth repeating here is narrower: wind and mechanical undercatch are two separate failure modes with two separate thresholds, and a single low rainfall total on a windy, intense day is plausibly both at once, not one or the other. Neither threshold, on its own, tells you which mechanism actually cost you water on a given day. Only checking the wind reading alongside the rain total starts to separate them.
Calibration drifts even when nothing looks broken
The NEWA review states a Rainwise tipping bucket carries an accuracy rating of 2 percent against a 1.5 inch per hour reference rate when new and correctly calibrated, meaning a manual check gauge and the tipping bucket should agree to within 2 percent over the same period. It then adds, without softening it, that calibration drift can push that error to 5 percent, possibly as high as 10 percent, with no timeline attached to how long that drift takes. A gauge that shipped accurate does not stay accurate by default. If the tipping bucket is reading below 90 percent of what a manual check gauge collects over the same period, the NEWA review's own diagnosis is a clog in the collector, not calibration. That distinction matters for what you do next: a calibration problem needs a technician and a reference gauge to fix properly, while a clog needs nothing more than someone walking out and looking at the funnel.
Mould, moss and the false drizzle
That clog diagnosis matters more in equatorial humidity than the source material was written for. The NEWA review lists leaves, moss, algae, pollen and general debris as the material that fouls a tipping bucket screen and drain, and recommends cleaning at least once or twice a year, with some sites needing it every three months. It also describes a specific tell: random trickling counts of small amounts logged every hour or two across a full day, which it attributes to a clogged bucket, a poorly mounted station swaying in wind, or a faulty reed switch, not to actual rain. A Kenyan collector left uncleaned through a wet season, with decaying plant matter and algae building inside the funnel, is a strong candidate for exactly this pattern: a string of tiny false tips that reads as light rain on a dry day, unless someone walks out and looks at the collector itself.
Siting rules that decide what the gauge can even see
The Cambridge Weather Observer's Handbook chapter on measuring precipitation, built on WMO CIMO guidance, sets exposure rules that predate any of the specific gauges discussed above: a gauge should not sit in wide open ground or on an elevated site such as the top of a knoll, and any nearby obstruction's height should not exceed twice its distance from the gauge. Those rules exist because the wind and splash errors already covered are worse in exactly those settings. A gauge on a raised platform in an open field, which is a common placement on Kenyan farms because it keeps the collector above crop height and out of reach of livestock, sits squarely inside the conditions the handbook warns against. Solving crop clearance without creating a wind-exposed site is a genuine siting trade-off, and there is no single correct answer to it in the sources here.
Rainfall behaves differently at points a short distance apart even without any equipment fault involved, which is the subject the comparison of phone-based rainfall data against field gauges works through in more detail. Siting error and genuine spatial variability compound each other, and a single gauge cannot tell you which one you are looking at.
What our own network shows about the spread
Across 8 NuaSense weather stations in Kenya over 14 August to 13 September 2026, station rainfall totals ranged from 0.0mm to 73.1mm. Those are different stations standing on different farms, not one location measured eight different ways, so this is not a claim that any single spot saw that range. It is, though, a reminder of how much rainfall varies across even a modest network before instrument error enters the picture at all. Over the same stretch, only 89 of 5,612 ten-minute readings across the network recorded any rain, 1.6 percent of all readings. Most of any Kenyan farm's record, in other words, is the gauge correctly reporting nothing, and the rare readings that do carry rain are the ones carrying all of the error modes described above.
A weather station that also reports leaf wetness duration, vapour pressure deficit and reference evapotranspiration, the way ours does, gives a second way to sanity-check a suspicious rain reading: a run of tiny tips with no corresponding rise in leaf wetness hours or humidity is a stronger case for a clogged collector than the rain total on its own. NuaSense's sensor and alert system is built around combining those channels rather than reading rainfall in isolation, precisely because a single gauge count, taken alone, cannot distinguish a light shower from a fouled screen.
Reading a small total for what it is, not what it isn't
A gauge that logs 0mm through a fast, intense burst has not necessarily seen no rain. Undercatch during high-intensity rainfall is a documented behaviour of the mechanism above roughly 50mm/h, not a rare failure. Equally, a gauge that logs a small, low-confidence total on a calm, slow drizzle day is closer to trustworthy, because neither of the two dominant error sources, wind and tipping-speed loss, is strongly in play. The tipping bucket is a good instrument for what it is built to do: count discrete, moderate-intensity rain reliably over a season. It is a poor instrument for adjudicating one borderline number in isolation, and the fix is not a better bucket, it is looking at what else the station recorded at the same hour before deciding the number means what it appears to mean.
Failure modes worth checking before you trust a low total
- High intensity: readings from bursts exceeding roughly 50mm/h in one-minute rates are the ones most likely to undercount, per Duchon and Biddle's comparison against a weighing-bucket reference.
- Wind exposure: undercatch becomes observable once 2m wind speed passes 5 m/s, and elevated or open siting makes this worse, not better.
- Calibration drift: a bucket that shipped at 2 percent accuracy can drift to 5 or 10 percent with no external sign that anything changed.
- Clogging: leaves, moss, algae and pollen buildup produce both undercounts and false small tips, and the NEWA review's fix is simply cleaning the collector, on a cycle as tight as every three months in some locations.
- Siting against WMO exposure rules: a gauge on an elevated platform in open ground, common on Kenyan farms to clear crop height, sits inside conditions the Cambridge handbook specifically warns against.
- Frozen precipitation: not a Kenyan lowland concern, but worth naming, since tipping buckets do not operate reliably with it at all.
A single 0.2mm-scale reading, whichever exact tip volume produced it, is never the whole story. It is one count from a mechanical seesaw, subject to at least five separate ways of being wrong, and the only way to know which of them, if any, is in play on a given day is to look at what else the station recorded alongside it.
Also drawn on for this piece: Siaya County weekly weather forecast.