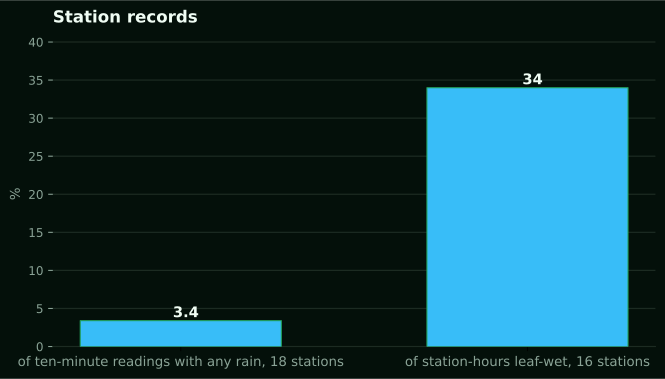
Rain in three percent of readings, leaves wet a third of the time
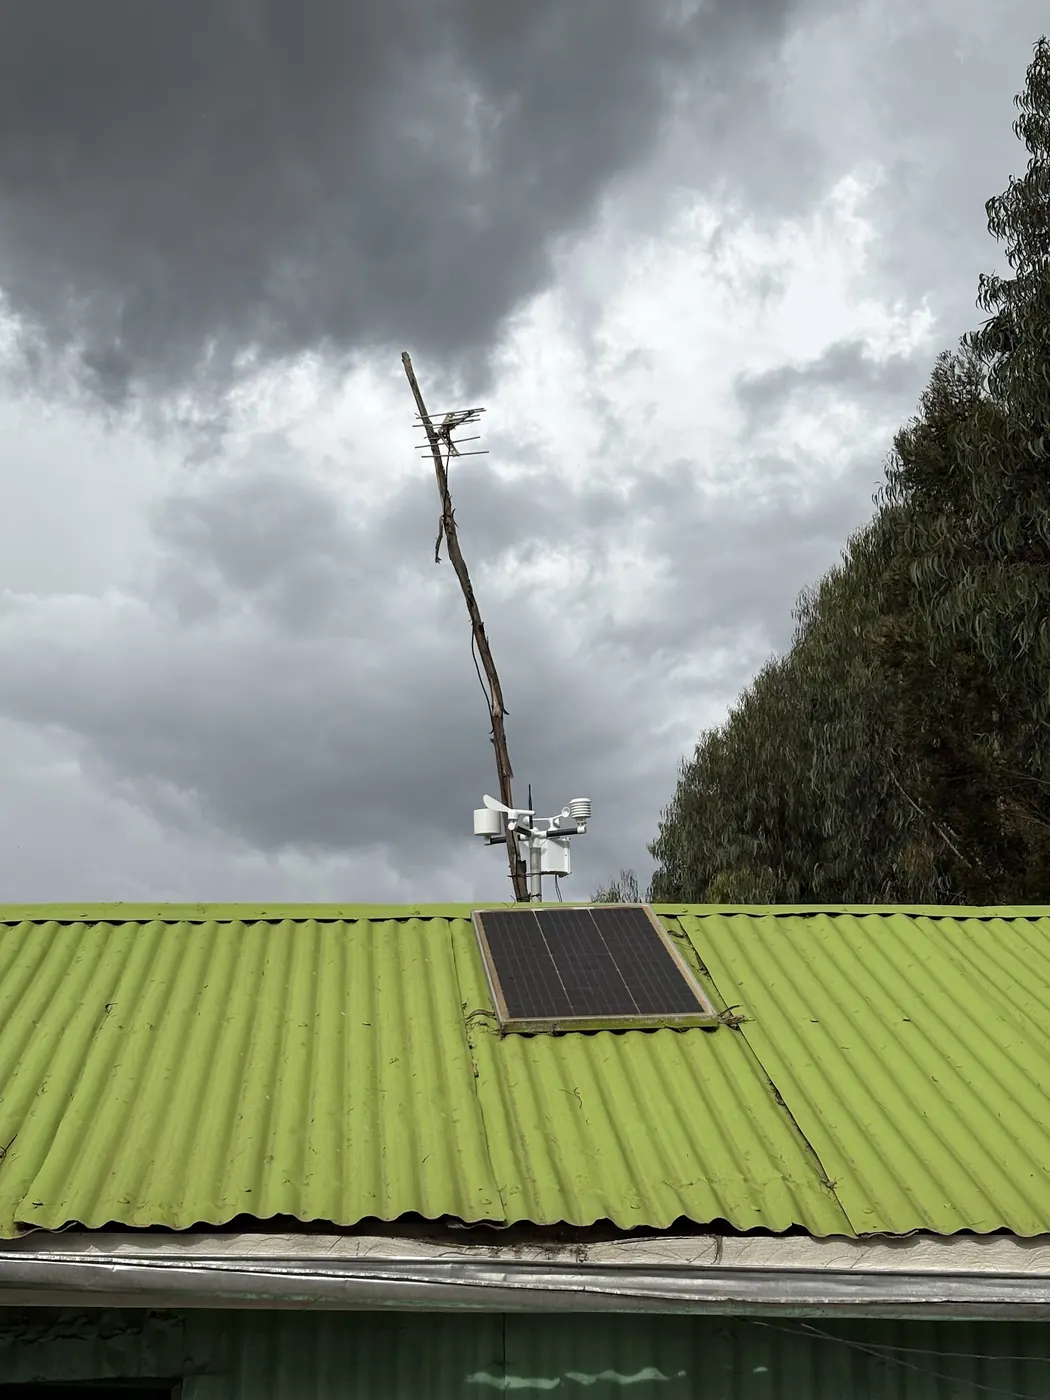
We looked at 18 NuaSense weather stations on Kenyan farms between 16 October and 15 November 2026. Of 32101 ten-minute readings, only 1083 caught any rain. That is 3.4 percent of the data. On 16 of those stations, leaves stayed wet for 34 percent of station-hours over the same month. Call it about 8.2 hours in an average day. Set the two figures beside each other and the assumption most growers carry, that a wet leaf means it rained, does not hold. The canopy was wet a third of the time while the bucket tipped in 3.4 percent of readings.
The other channels explain it. Relative humidity across the network averaged 74 percent for the period and reached 100. Vapour pressure deficit, worked out from each station's own temperature and humidity, averaged 0.72 kPa. When the air is near saturation, the night is cool and the leaf radiates its heat to a clear sky, you get dew with no cloud in sight. The rain gauge stays silent. The disease clock keeps running.
A year of farm weather data on a Kenyan farm teaches this first: the number you went looking for is seldom the number that changed your week. Rainfall is what goes in the diary. Leaf wetness duration is what decides whether the fungicide went on in time. On those same 16 stations, 57 percent of 8887 station-hours scored below 30 on our spray quality index. Only 22 percent scored 60 or better. A wet month with few rainy readings is still a month with few good spraying hours, because wind, humidity and a wet leaf all count against the window, and a tipping bucket records none of them. Keep hold of that gap between what fell and what was wet. Everything below works outward from it, one number at a time, and it ends with four things to change on Monday.
Eighteen masts, one month, and a spread from nothing to 143 mm
The rainfall column holds a second surprise. Across 15 NuaSense weather stations in Kenya, totals for 16 October to 15 November 2026 ran from 0.0 mm to 143.1 mm. Those stations are not co-located. They stand on private farms we do not name, so the spread is a spread between places, never a regional figure. Stare at it anyway. In the month most people in Kenya call the start of the short rains, one gauge caught nothing and another caught 143.1 mm.
Over the same month, air temperature across 18 stations ran from 0.0 to 41.6 °C, with a mean of 19.2 °C. A mean on its own says little. The ends matter, and they belong to different masts on different mornings, not to one farm swinging through the whole range. Reference evapotranspiration, computed hourly with FAO-56, averaged 1.4 mm per day across 16 stations. That is a well-watered grass surface, not what any crop used. What this month establishes is modest. A network average tells you almost nothing about one block, and the whole value of a mast on your own farm is that its numbers belong to your soil and your slope and nobody else's.
The year this site cannot print, and the one you should
Our title promises a year. Here is the limit, stated plainly. We will not print one station's twelve months, because every NuaSense station stands on a private farm and its record belongs to the owner. What we can quote is the network, aggregated over a stated past period, and the record queried for this piece covers one month. A twelve-month series of monthly totals, a hottest and coldest reading, a longest dry spell and a wettest day for a named farm would have to be invented. An invented weather record is worse than none.
So the year this article is about is yours, and the useful question is what turns readings into a record. On that, the Embu County rainfall study from the University of Embu gives the clearest answer available. It worked from two stations, Embu at 1,409 m and Machang'a at 1,106 m, over a 13-year record period. A station-year was kept only where less than 10 percent of the data was missing, which the authors describe as the World Meteorological Organization requirement. The remaining gaps were filled with multiple imputation rather than guesswork. Those decisions were made before any rainfall figure was quoted, and they are the reason the figures can be quoted at all.
Translate that to a mast on a Kenyan farm. A station reporting roughly every 10 minutes gives you a dense record, but a fortnight offline while the solar panel sat under dust or the SIM lapsed can push a month past that 10 percent line. Downtime is the enemy of the annual record. That is why the monthly cleaning and check routine on this site matters more for the data than for the hardware. Write the outage dates in the diary. A year with a known hole is a usable year. A year with a hidden one is not, and nobody will tell you which you have except the diary.
A rainy day is a threshold you choose
Decide what counts as a rainy day before you start counting them. The sources disagree, and neither is wrong. Embu's authors called any day with more than 0.2 mm a rainy day. The IGAD wet-day and dry-spell study, using CHIRPS rainfall data and a multi-model ensemble of 10 CMIP6 simulations, set a wet day at a 1 mm minimum. It defined a dry spell as a run of days with no rain at that threshold. Neither figure is the official Kenyan definition, and the sources do not give one. Each author states their choice openly.
That choice moves the answer. Under the Embu rule, 0.5 mm is a rainy day. Under the IGAD rule it is a dry day. Put a few of those together in a dry month and your longest dry spell comes out one length at 0.2 mm and a longer length at 1 mm, from the same gauge and the same diary. A tipping bucket has its own wrinkle. It counts tips and turns them into millimetres using the per-tip volume it is calibrated to. So a trace of drizzle that never fills the bucket reads zero in the log, however wet the morning felt. Write the threshold on the first page of the station diary. Never change it mid-year. If you must change it, start a new column and keep the old one.
Assume the dry spell
A year of records earns its keep on dry spells, and the Embu figures call for a different posture. In the drier parts of Embu County, the study found dry-spell probabilities inside the growing months of 81 percent at Machang'a and 60 percent at Embu. At those same stations it found probabilities of 0.67 and 0.40 of droughts exceeding 15 days. In those agro-ecologies, a dry spell within the season is the default. A farm plan that treats it as a failed season is planning for the wrong year.
Set against that, the IGAD study looks reassuring. The contrast is worth understanding, not smoothing over. Across Kenya, Somalia, south-eastern Ethiopia, Eritrea and Djibouti it reports a probability of less than 5 percent of exceeding 7, 14, 21 or 28 days, one to four spells. That is a coarse regional result from gridded data at a 1 mm threshold. Embu's result comes from two gauges over 13 years at 0.2 mm in a specific semi-arid pocket. There Mbeere Sub-county averages 781 mm a year, against above 1,210 mm at Embu. A grid cell averages away the sharp local dry spells that a gauge in the drier part records. The two thresholds pull the spell lengths apart before anyone compares them.
Your own mast settles this for your block and for nobody else. Count the longest run of days below your threshold in each growing season. Write it down. After one year you have an anecdote. After a few you have a distribution. Then the question shifts from whether a dry spell will come to how long the ones that come tend to run. That is a question with an answer. Where a soil sensor is installed, the deeper probe checks that count. A run of dry days that never moves the deeper reading is a different event from one that does. Only the pair of records tells them apart. Soil moisture across our 13 probes averaged 62 percent of sensor scale over the month, with most readings between 26 and 87 percent, both depths pooled. That scale is relative, not volumetric water content. The number you want from it is movement, not level.
The wettest day sizes the drains, not the harvest
Most growers see the wettest day of the year as a rainfall record. It is more useful as an erosion record. Embu's authors note that about 25 percent of the annual rain in their study area often falls in a couple of rainstorms, so crops suffer water stress despite adequate seasonal totals. The storm that pads the monthly total is the one that strips topsoil, overtops the cut-off drain and runs off before the profile has taken a fraction of it. Your drainage, terrace spacing and grassed waterway are sized by the biggest day, never the biggest month.
A ten-minute record shows this in a way a daily gauge cannot. Two days with the same total can be a soaking afternoon or a cloudburst. Only a station that logs the tips through the hour tells you which. Pair the wettest day with the shallow probe's reading before and after it. If the shallow probe barely moved on the wettest day of the year, the water left as runoff and the layout failed its test. For context, the CHIRPS record at the grid cells where our stations stand gives a November average of 119 mm across 43 years from 1983 to 2025. The driest was 52 mm in 2025 and the wettest 288 mm in 2019. A 288 mm month and a 52 mm month can each hide a single day that did the real damage. The monthly column will never show it.
Hottest and coldest readings belong to the shield and the hour
The hottest and coldest readings on a station are the two numbers most likely to be wrong. The fault is seldom the sensor. Across our 18 stations the month ran from 0.0 to 41.6 °C. A reading of 41.6 °C is plausible on a hot lowland mast. It is also what a thermometer reports when its radiation shield is clogged and the sun is on it. A 0.0 °C reading is a real frost at altitude, or a shield facing a cold sky over bare ground on a still night. The number alone does not tell you which.
Our weather station siting guide shows how much clear ground each sensor needs, and why the shield is the instrument that matters for temperature. There is a simpler habit for catching a bad extreme. Write down the hour each day's maximum and minimum happened. If the daily maximum comes in the early afternoon with a clean shield, that is weather. If it comes just as the sun first reaches the mast, and humidity drops at the same moment, treat it as a shield problem. The year's record should say that beside the value, not carry it as fact.
Soil temperature follows a similar pattern. The two depths averaged 23.2 °C across 13 probes over the period. But the steadier depth moved through a range of 32.7 °C, while the more variable one moved through 46.8 °C. That is a factor of 1.4 if the steadier span is taken as one. In your year, the hottest and coldest soil readings will almost always come from the shallow probe. They will land at the same hours as the air extremes. For a crop decision, the deeper probe's extremes are usually the ones to carry. The roots are there, and the shallow spike is gone by evening. Write both, and mark which probe each came from.
Rainy days swing more than rainfall totals
Ask growers which number in a year's farm weather record swings most, and they will name the total. The Embu record says otherwise. Seasonal rainfall amounts had coefficients of variation of 0.56 at Machang'a and 0.38 at Embu. Rainy-day counts were more variable still: 0.88 at Machang'a and 0.27 at Embu. Even the peak months did not settle. April carried 0.42 and 0.48, and November 0.76 and 0.43, at Machang'a and Embu respectively. A coefficient of 0.88 means the count of days the gauge tipped at Machang'a varied almost as much as its own average from season to season.
That pattern is behind the finding of a 90 percent chance that short-rains rainfall in the drier parts of Embu County falls below the 500 mm cropping threshold. The one-year return-period amount is 213.5 mm at Machang'a and 258.1 mm at Embu, against annual potential evapotranspiration of 2,000 to 2,300 mm and 700 to 900 mm of rain. For planting dates, count rainy days per block. Count millimetres alongside. A millimetre total alone can mislead at a Machang'a-type site in a way it will not at an Embu-type one, and your own year will tell you which type you have.
Ten-day blocks, because that is how the national bulletin counts
The Kenya Meteorological Department puts out 10-day agrometeorological bulletins all year. They cover rainfall distribution, soil moisture, temperature and crop conditions. KMD's agrometeorology page describes how its agro-advisories turn that data into guidance on planting, harvesting, irrigation and pest management, and how that guidance feeds food-security early warning. For a farm station, the ten-day cadence is the natural reporting period. A month built from three ten-day blocks sits beside the official bulletin without conversion. A year built from thirty-six blocks is a record you can hand to an agronomist or a lender without explaining your own format first.
Blocks also match how the numbers above behave. A dry spell over 15 days spans at least two blocks. It shows up as two low rainy-day counts in a row, which is easier to see on a phone than a run of zeros in a daily column. Sum leaf-wet hours per block, and disease-pressure periods sit in the same table as the rain. Hours at 60 or better on the spray index, counted per block, tell you how many usable windows the block gave you. Over a year, that is worth knowing before you buy a sprayer with more capacity than the weather will let you use. NuaSense's own guide to applying pesticides safely covers the other half: identify the pest first, choose between insecticide, fungicide and herbicide, and read conditions before the tank goes on. The station's hourly index is the record of whether those conditions ever arrived.
You apply for and pay for KMD's services through an eCitizen account, as KMD's eCitizen service page sets out. Its mandate rests on Executive Orders and the World Meteorological Organization Convention. KMD is the authority here. Your farm's figures do not replace its bulletin. They tell you where your block sits inside the picture it paints for a whole county.
A gauge on the ground checks the satellite, it does not replace it
Three satellite rainfall products are used in Kenyan agriculture. The Kenya Agricultural Observatory Platform describes all three. CHIRPS is a quasi-global dataset of 35-plus years, spanning 50°S to 50°N and all longitudes, running from 1981 to near-present. The University of Reading established TAMSAT in 1977 to provide satellite-based rainfall estimates to African meteorological agencies. Africa Rainfall Climatology 2.0 is a 29-year dataset centred over Africa at 0.1° resolution. All three are estimates for a grid cell. None is a bucket on your mast.
A physical station checks the grid on the ground; it does not repeat it. When a gauge reads 0.0 mm for a month and its cell says something else, the gauge is reporting the farm, while the grid is averaging an area that takes in the hill where it did rain. That 0.0 to 143.1 mm spread across 15 stations is the same gap seen in the field. Cells overlap. Buckets do not. And a gauge can be wrong: a funnel stuffed with leaves gives you a dry month that the satellite will contradict, and putting the two side by side catches that too.
IGAD's authors drew their whole regional picture from CHIRPS. That includes the finding that the region had fewer wet days and long dry spells in the 1980s, before what they call an extraordinary rise in wet days from 2011 to 2020 across the March-May, June-September and October-December seasons. It is a regional pattern covering several countries, not a Kenyan one, and only a grid can make a statement on that decade scale. Our dashboard sets the farm's own readings beside the public rainfall layers, free to read at agriculture-data.com, so the check takes a glance, not a spreadsheet. The rain gauge page on this site explains what the tipping bucket is doing underneath.
What to buy, and what to change on Monday
Money first, then Monday. CGIAR's digital agriculture profile for Kenya counts about 113 institutions that offer digital solutions for agriculture, with 64 based in the country. It names weather station technology as one of the most promising high-impact solutions for Kenyan growers. It also lists high technology costs, low digital literacy and limited access to infrastructure as the main constraints on adoption, and puts the sector at 8.6 million producers who largely lack such tools. Both halves hold at once.
Be honest about the cheaper option. If all you want is a monthly total to set against the bulletin, read a manual gauge every morning at the same hour and write it in a notebook. That gives you the number with no SIM and no mast, and for that grower no purchase beyond the gauge is the right call. A logging station earns its keep when you want the numbers this piece has been about: the hour of the maximum, the tips inside a storm, leaf-wet hours, spray-window hours, and a dry spell counted without you. No notebook holds hourly quantities. A NuaSense weather station costs KES 30,000 excluding taxes, and a soil sensor costs KES 7,000. The station reaches the internet over a Safaricom SIM at about one US dollar a month passed on at cost, or over Wi-Fi for nothing, and the dashboard comes included. A proposed IoT mini weather station described in a paper on the NRF repository shows the same idea in academic form: humidity, temperature, light and pressure sent to a cloud server for advisories. It remains a design rather than something you can buy.
On Monday, do four things. Put the rainy-day threshold on the first page of the diary. Rule a table in ten-day blocks, with columns for millimetres, rainy days, leaf-wet hours and hours at 60 or better on the spray index. Beside each temperature value, note the hour of that day's maximum and minimum. Then check the station has reported without a gap. A year of farm weather data is only a year if less than a tenth of it is missing.